Unlock a world of possibilities! Login now and discover the exclusive benefits awaiting you.
- Qlik Community
- :
- All Forums
- :
- QlikView App Dev
- :
- Chat Generation
- Subscribe to RSS Feed
- Mark Topic as New
- Mark Topic as Read
- Float this Topic for Current User
- Bookmark
- Subscribe
- Mute
- Printer Friendly Page
- Mark as New
- Bookmark
- Subscribe
- Mute
- Subscribe to RSS Feed
- Permalink
- Report Inappropriate Content
Chat Generation
how to generate like this
- Mark as New
- Bookmark
- Subscribe
- Mute
- Subscribe to RSS Feed
- Permalink
- Report Inappropriate Content
Sorry, I don't understand what you want. Could you explain a bit more?
In QV11, there is a server based annotation feature, which could be used for something like a forum / chat / annotations, linked to sheet objects.
If you really need a chat, I would suggest using one of the external chat programs.
- Mark as New
- Bookmark
- Subscribe
- Mute
- Subscribe to RSS Feed
- Permalink
- Report Inappropriate Content
this structure i want in chart
- Mark as New
- Bookmark
- Subscribe
- Mute
- Subscribe to RSS Feed
- Permalink
- Report Inappropriate Content
Sorry, I misread your Post header, now I see:
I think you can use a pivot table chart for a table like you attached. First dimension Quarter, second Month.
Then you could use three expression that aggregate your values. I personally wouldn't repeat mn, bn (for million, billion ?) at each line, but just state it at the expression header label.
Not sure if this all is really helpful for you, but without knowing your data (model) and your aggregation needed, I don't know what more to say.
Pivot tables are one of the chart sheet objects types.
Regards,
Stefan
- Mark as New
- Bookmark
- Subscribe
- Mute
- Subscribe to RSS Feed
- Permalink
- Report Inappropriate Content
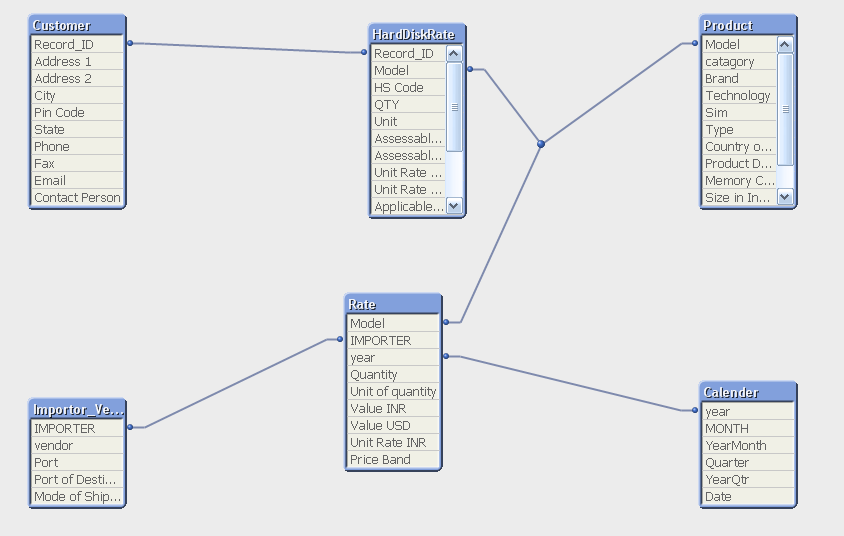
this is my Daa Model ..if any errors in daa model pls suggest..if you want excel file means ..i will sen to you if you want means
- Mark as New
- Bookmark
- Subscribe
- Mute
- Subscribe to RSS Feed
- Permalink
- Report Inappropriate Content
All depends on what you want to achieve, what your requirements are. What are the fields you need to aggregate?
I see that your calendar is only linked by year to Rate table (you only have a year field in Rate table), so I assume it's getting hard to group / evaluate your data per Quarter and Month.
If you want to share some data, that might help, but more important is that you need to know what you want to do with your data.