Unlock a world of possibilities! Login now and discover the exclusive benefits awaiting you.
- Qlik Community
- :
- All Forums
- :
- QlikView App Dev
- :
- Class with dates
- Subscribe to RSS Feed
- Mark Topic as New
- Mark Topic as Read
- Float this Topic for Current User
- Bookmark
- Subscribe
- Mute
- Printer Friendly Page
- Mark as New
- Bookmark
- Subscribe
- Mute
- Subscribe to RSS Feed
- Permalink
- Report Inappropriate Content
Class with dates
Hi Community:
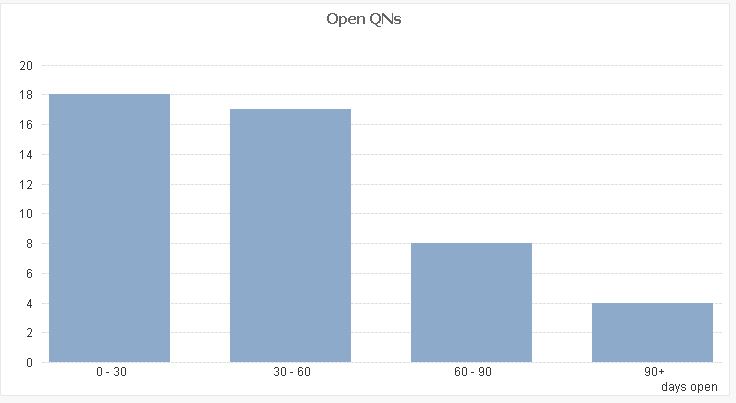
I am trying to make a chart that looks like the following:
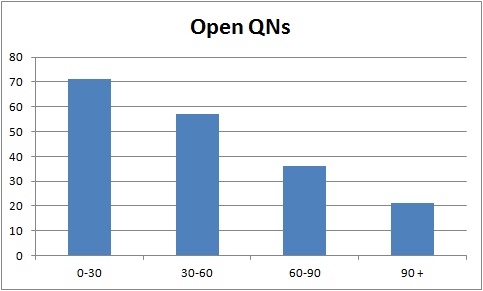
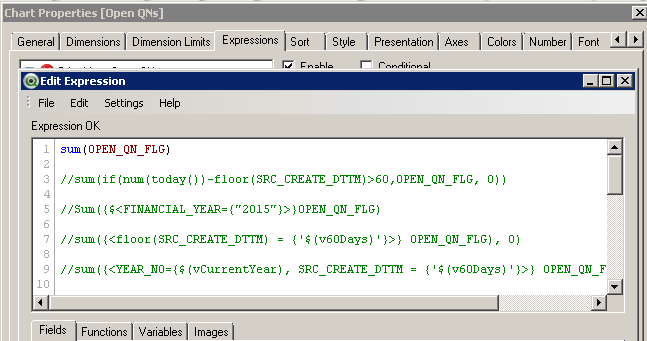
Here is my data. I am using the OPEN_QN_FLG field from the QN table and SRC_CREATE_DTTM field from the Squawk table.
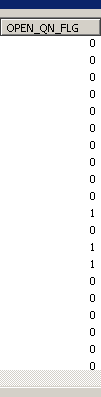
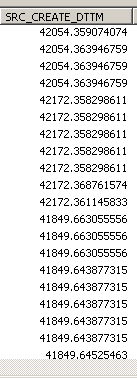
The SRC_CREATE_DTTM is in number format and is the date that the quality notification (QN) was opened. The OPEN_QN_FLG field shows a 1 if the notification is still opened, and a 0 if it is closed. For my chart, I am only interested in the open QNs, or 1s.
This is the chart I am getting, and can't figure out how to fix it:
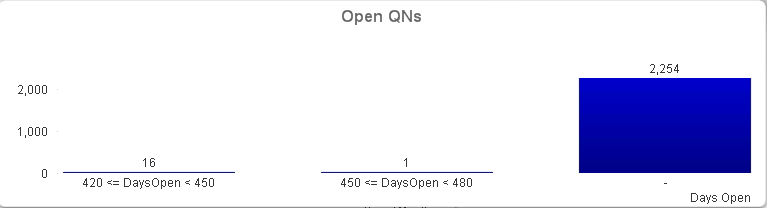
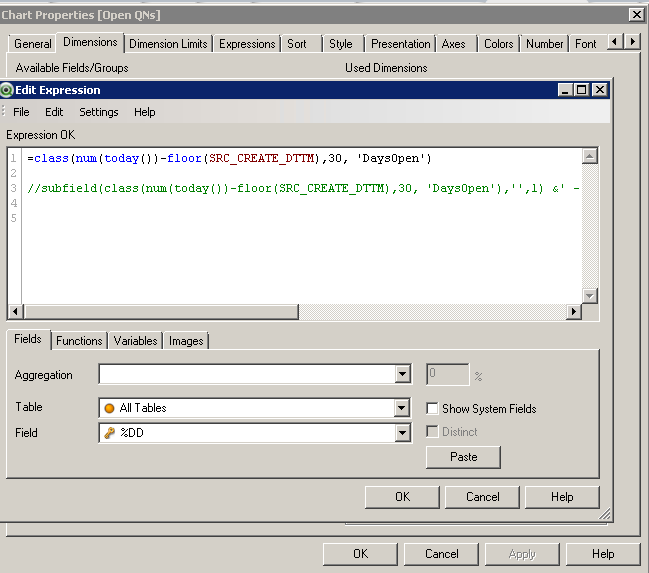
I commented out a lot of lines just because I have tried a lot of stuff and cannot get anything to work right. I put the num in front of TODAY so that it is in the same format as the SRC_CREATE_DTTM. Since the SRC_CREATE_DTTM has so many decimals, I used FLOOR in order to get rid of them.
I ideally do not want to change anything in the back end, if possible, because someone else is working on that as I design the front end. However, if that is the only option we can work together to add to that.
Thanks!
- Tags:
- qlikview_scripting
- « Previous Replies
-
- 1
- 2
- Next Replies »
- Mark as New
- Bookmark
- Subscribe
- Mute
- Subscribe to RSS Feed
- Permalink
- Report Inappropriate Content
Hi,
although you already solved it on your own, one solution might be also to combine the class() and the dual() functions to avoid sorting issues:
=If(Today()-Floor(SRC_CREATE_DTTM)>=90,Dual('90+',90),Dual(Replace(Class(Today()-Floor(SRC_CREATE_DTTM),30),'<= x <','-'),Class(Today()-Floor(SRC_CREATE_DTTM),30)))
hope this helps
regards
Marco
- Mark as New
- Bookmark
- Subscribe
- Mute
- Subscribe to RSS Feed
- Permalink
- Report Inappropriate Content
HI
I have same problem,
But i need this buckets with filter column with date. When i select this date from that date i should get past 90 days and bucketing should happen. Was your solution is with filter column.If yes, Can you please share it
- « Previous Replies
-
- 1
- 2
- Next Replies »