Unlock a world of possibilities! Login now and discover the exclusive benefits awaiting you.
- Qlik Community
- :
- All Forums
- :
- QlikView App Dev
- :
- Color Not displaying correctly!!!
- Subscribe to RSS Feed
- Mark Topic as New
- Mark Topic as Read
- Float this Topic for Current User
- Bookmark
- Subscribe
- Mute
- Printer Friendly Page
- Mark as New
- Bookmark
- Subscribe
- Mute
- Subscribe to RSS Feed
- Permalink
- Report Inappropriate Content
Color Not displaying correctly!!!
Hello QV Experts,
I have a bar chart shown with Top5 customer Sales displayed.
Customer1 shown with Color1
Customer2 shown with Color2
.
.
.
etc.
In dimension, Customer [ Original Column] is Added, then Selecting the Customer2 shown with Color2 even if i drilldown or select only that particular customer.
But suppose if i have CalculatedDimension for Customer [with some validations], then Selecting the Customer2 shown with Color1 which is the first color in Color Palette [1-6].
Even in CalculatedDimension, Can we get the same Color2 if i select Customer2? Can anyone suggest me on this.
Appreciate your help!!!
Thanks,
Sasi
- Tags:
- new_to_qlikview
- Mark as New
- Bookmark
- Subscribe
- Mute
- Subscribe to RSS Feed
- Permalink
- Report Inappropriate Content
Might be helpful, if you could post an example
Peter
- Mark as New
- Bookmark
- Subscribe
- Mute
- Subscribe to RSS Feed
- Permalink
- Report Inappropriate Content
as peter said, you you post an example.
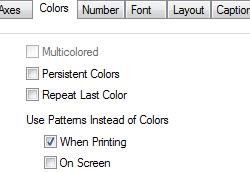
One option you may want to look into is on the color tab - check persistent colors - that should keep the same color of the bar after it is clicked
- Mark as New
- Bookmark
- Subscribe
- Mute
- Subscribe to RSS Feed
- Permalink
- Report Inappropriate Content
Hi sasi kumar,
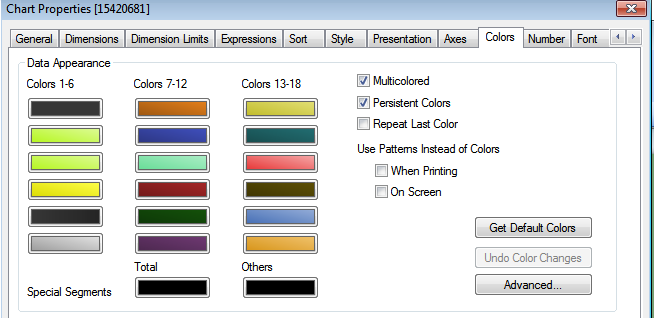
These are the default colors ,
can u please share little bit more
- Mark as New
- Bookmark
- Subscribe
- Mute
- Subscribe to RSS Feed
- Permalink
- Report Inappropriate Content
Dear QV Experts,
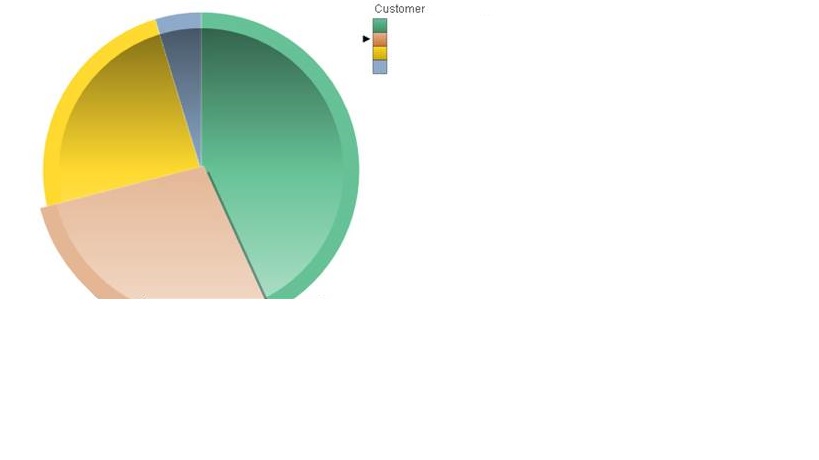
Top5 Customers, [Pie Chart]
Before drill down or filtering, Five customers with five different colors.
If i add Calculated Dimension, while selecting any one customer displays like below. Picks the first color from the Color Palette.
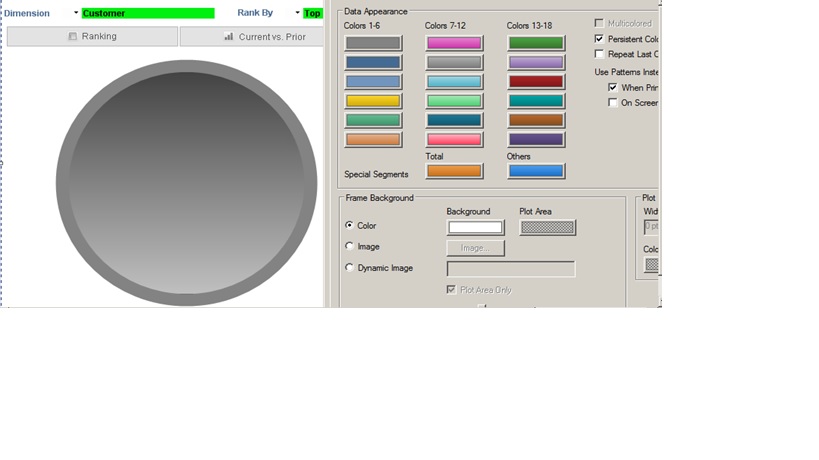
Expectation:
If I am not using Calculated Dimension & only Customer, then I am getting.
But I need to display such even if I use calculated dimension.
Thanks,
Sasi
- Mark as New
- Bookmark
- Subscribe
- Mute
- Subscribe to RSS Feed
- Permalink
- Report Inappropriate Content
Please post a sample of what kind of Calculated dimension you are using...
S.
- Mark as New
- Bookmark
- Subscribe
- Mute
- Subscribe to RSS Feed
- Permalink
- Report Inappropriate Content
Hello Simone,
Sounds Good. But this scenario works for me.
But if i have calculated dimension with some validation only it is not working.
For Ex,
=if(%Ranking_No='1', aggr(if(rank(Sum({$}{<[Year]={$(VCurrentYear)},Date={'<=$(vMaxInvoiceDate)'}>}Sales))<=vTopX,Customer),Customer),
if(%Ranking_No='2',aggr(if(rank((Sum({<[Year]={$(VCurrentYear)}>}Sales) - Sum({<[Year]={$(=(VCurrentYear)-1)},Date={'<=$(vAsOfDatePY)'}>}Sales) ))<=vTopX,Customer),Customer),
if(%Ranking_No='3',aggr(if(rank((Sum({<[Year]={$(VCurrentYear)}>}Sales) - Sum({<[Year]={$(VCurrentYear)}>}PlannedSalesAmtYTD) ))<=vTopX,Customer),Customer),
if(%Ranking_No='4',aggr(if(rank(-(Sum({<[Year]={$(VCurrentYear)}>}Sales) - Sum({<[Year]={$(=(VCurrentYear)-1)},Date={'<=$(vAsOfDatePY)'}>}Sales) ))<=vTopX,Customer),Customer),
if(%Ranking_No='5',aggr(if(rank(-(Sum({<[Year]={$(VCurrentYear)}>}Sales) - Sum({<[Year]={$(VCurrentYear)}>}PlannedSalesAmtYTD) ))<=vTopX,Customer),Customer),
if(%Ranking_No='6',aggr(if(rank(num(((Sum({<[Year]={$(VCurrentYear)}>}Sales) - Sum({<[Year]={$(=(VCurrentYear)-1)},Date={'<=$(vAsOfDatePY)'}>}Sales))
/Sum({<[Year]={$(=(VCurrentYear)-1)},Date={'<=$(vAsOfDatePY)'}>}Sales)),'#,##0%'))<=vTopX,Customer),Customer))
)))))
Here %Ranking_No is Inline Table.
Ranking_Option:
Load * INLINE [
%Ranking_No,%Ranking_Option
1,Top by Current Year Sales
2,Top by Growth Variance
3,Top by Plan Variance
4,Bottom by Growth Variance
5,Bottom by Plan Variance
Thanks a Million
Sasi
- Mark as New
- Bookmark
- Subscribe
- Mute
- Subscribe to RSS Feed
- Permalink
- Report Inappropriate Content
I don't think Persistent Colors works with most calculated dimensions. You have to simulate persistent colors by using a background color expression like:
color(FieldIndex('X',X))
where X is the dimension field.
-Rob