Unlock a world of possibilities! Login now and discover the exclusive benefits awaiting you.
- Qlik Community
- :
- All Forums
- :
- QlikView App Dev
- :
- Color change for bar graph
- Subscribe to RSS Feed
- Mark Topic as New
- Mark Topic as Read
- Float this Topic for Current User
- Bookmark
- Subscribe
- Mute
- Printer Friendly Page
- Mark as New
- Bookmark
- Subscribe
- Mute
- Subscribe to RSS Feed
- Permalink
- Report Inappropriate Content
Color change for bar graph
Hi All,
I have attached the screen shots because i cannot copy the QVW file.
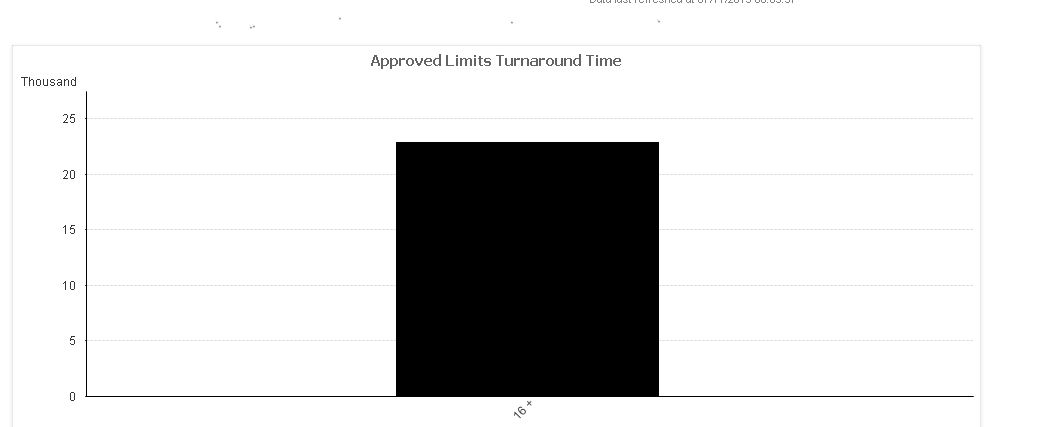
Dimension : =if(IsNum([Turnaround Time Network Days]), IF([Turnaround Time Network Days]>15, '16 + ', [Turnaround Time Network Days]),'Missing Dates')
Fact : Count([Turnaround Time RAG])
Colors of the bars should be GREEN AMBER and RED based on condition.
Condition : if ([Turnaround Time Network Days])>7, Red()
if ([Turnaround Time Network Days])<=3, Green()
if ([Turnaround Time Network Days])<=7, Amber()
I got the colors but the problem is if [Turnaround Time Network Days]>15 i have grouped into '16+' i want this bar to be in RED(). I am not able to do it. Please help me with this.
Check the screen shots.
Thanks & Regards,
Keerthi
- Mark as New
- Bookmark
- Subscribe
- Mute
- Subscribe to RSS Feed
- Permalink
- Report Inappropriate Content
Ok then modify the expression as follows:
if ([Turnaround Time Network Days])<=3, Green(),
if ([Turnaround Time Network Days])<=7, Amber(),
if ([Turnaround Time Network Days])>7,Red(),Black())))
- Mark as New
- Bookmark
- Subscribe
- Mute
- Subscribe to RSS Feed
- Permalink
- Report Inappropriate Content
I gave the same expression but '16+' is coming in Black 
- Mark as New
- Bookmark
- Subscribe
- Mute
- Subscribe to RSS Feed
- Permalink
- Report Inappropriate Content
16+ should be in RED.
- Mark as New
- Bookmark
- Subscribe
- Mute
- Subscribe to RSS Feed
- Permalink
- Report Inappropriate Content
Please provide me the expression.
- Mark as New
- Bookmark
- Subscribe
- Mute
- Subscribe to RSS Feed
- Permalink
- Report Inappropriate Content
I got the issue, it is because '16+' behaves as string while except missing dates all are numeric values. So further little modification required.
if ([Turnaround Time Network Days]<=3, Green(),
if ([Turnaround Time Network Days]<=7, Amber(),
if ([Turnaround Time Network Days]>7 or [Turnaround Time Network Days]='16+',Red(),Black())))
Hope this works.
- Mark as New
- Bookmark
- Subscribe
- Mute
- Subscribe to RSS Feed
- Permalink
- Report Inappropriate Content
Still 16+ is coming in black
- Mark as New
- Bookmark
- Subscribe
- Mute
- Subscribe to RSS Feed
- Permalink
- Report Inappropriate Content
if (num([Turnaround Time Network Days])<=3, Green(),
if (num([Turnaround Time Network Days])<=7, Amber(),
if (num([Turnaround Time Network Days])>7,Red(),Black())))
- Mark as New
- Bookmark
- Subscribe
- Mute
- Subscribe to RSS Feed
- Permalink
- Report Inappropriate Content
Hi
Create the dimension based on this expression in script and then use that field as dimension in bar chart.
ex:
Load
if(IsNum([Turnaround Time Network Days]), IF([Turnaround Time Network Days]>15, '16 + ', [Turnaround Time Network Days]),'Missing Dates') AS TurnAround,
*
From tablename;
Then use TurnAround as Dimension.
We can apply color for that dimension.
Please close the thread by marking correct answer & give likes if you like the post.
- Mark as New
- Bookmark
- Subscribe
- Mute
- Subscribe to RSS Feed
- Permalink
- Report Inappropriate Content
Sorry again 16+ in Black
- Mark as New
- Bookmark
- Subscribe
- Mute
- Subscribe to RSS Feed
- Permalink
- Report Inappropriate Content
Try this
Expression -> click the '+' sign -> background color
IF([Turnaround Time Network Days] < 3, Green(),
if([Turnaround Time Network Days] < 7, Yellow(), // instead of yellow, use RGB for amber
if([Turnaround Time Network Days] ='16+', red())))