Unlock a world of possibilities! Login now and discover the exclusive benefits awaiting you.
- Qlik Community
- :
- All Forums
- :
- QlikView App Dev
- :
- Re: Color in bar chart depending on dimension valu...
- Subscribe to RSS Feed
- Mark Topic as New
- Mark Topic as Read
- Float this Topic for Current User
- Bookmark
- Subscribe
- Mute
- Printer Friendly Page
- Mark as New
- Bookmark
- Subscribe
- Mute
- Subscribe to RSS Feed
- Permalink
- Report Inappropriate Content
Color in bar chart depending on dimension value
Hi guys!
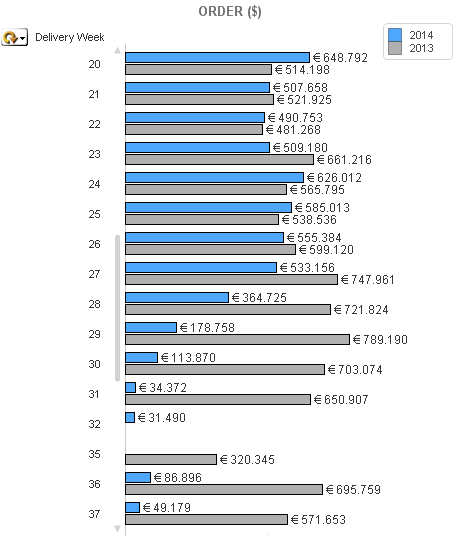
I have a bar chart displaying the value of the order and the dimension is the delivery week.
So, i have on the chart the orders scheduled for week 20, 21, 22... (as you can see in the attached picture).
Here is the problem!!!
I want to color differently the bar, depending on the delivery week.
I explain better. Suppose we are in week 24.
I would like to:
1) the bar of previous weeks (23, 22, 21 and behind) are in black color,
2) the bar of our current week is red,
3) the bar of future weeks (25, 26, 27...) are in green color.
I thought to use the color function of the expression but I don't know how to get the x value, i.e. the delivery week.
Which function should I use?
Is there a more correct way?
Hope you can help me!!!
Thanks in advance!!!
Accepted Solutions
- Mark as New
- Bookmark
- Subscribe
- Mute
- Subscribe to RSS Feed
- Permalink
- Report Inappropriate Content
Could you post your sample app?
You could try like:= If(Week(Today())>[Delivery Week], Green(), If(Week(Today())=[Delivery Week],Red(),Black()))
- Mark as New
- Bookmark
- Subscribe
- Mute
- Subscribe to RSS Feed
- Permalink
- Report Inappropriate Content
Could you post your sample app?
You could try like:= If(Week(Today())>[Delivery Week], Green(), If(Week(Today())=[Delivery Week],Red(),Black()))
- Mark as New
- Bookmark
- Subscribe
- Mute
- Subscribe to RSS Feed
- Permalink
- Report Inappropriate Content
Easier than I suppose!!! It works!!!
Thanks tresesco!!!
- Mark as New
- Bookmark
- Subscribe
- Mute
- Subscribe to RSS Feed
- Permalink
- Report Inappropriate Content
I thank you too soon! Your answer is correct but I got another problem!
In the chart I have an expression with set analysis which ignore (override) the user selection.
But if statement consider the selection, so the colors change even if they should not!!!
How can I ignore the selection with the if statement?
- Mark as New
- Bookmark
- Subscribe
- Mute
- Subscribe to RSS Feed
- Permalink
- Report Inappropriate Content
try like:
=Only( {your set} If(....))
- Mark as New
- Bookmark
- Subscribe
- Mute
- Subscribe to RSS Feed
- Permalink
- Report Inappropriate Content
Made my day!!! It works!!!
But could you explain me briefly the "only" function?
- Mark as New
- Bookmark
- Subscribe
- Mute
- Subscribe to RSS Feed
- Permalink
- Report Inappropriate Content
Only is an aggregation function (note: set analysis can be used only in aggregation functions) that returns a value if there is only one value in the scope otherwise returns a null. I took only() to take just the advantage of set analysis. 