Unlock a world of possibilities! Login now and discover the exclusive benefits awaiting you.
- Qlik Community
- :
- All Forums
- :
- QlikView App Dev
- :
- Color only symbols (Part of the text) not entire c...
- Subscribe to RSS Feed
- Mark Topic as New
- Mark Topic as Read
- Float this Topic for Current User
- Bookmark
- Subscribe
- Mute
- Printer Friendly Page
- Mark as New
- Bookmark
- Subscribe
- Mute
- Subscribe to RSS Feed
- Permalink
- Report Inappropriate Content
Color only symbols (Part of the text) not entire cell
Hi All,
Currently, I have a dashboard and I am using three symbols to show the KPI in a pivot table. Below is my expression
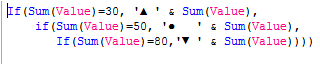
And, I am using text format expression as

My table looks like below.
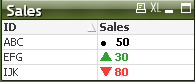
Now, I wish to show the numbers in black color and the symbols should be as it is. I have tried some methods but nothing looks good. Is it possible achieve my request.? If not possible, can anyone provide me an alternate solution.?
Thank you.
- Mark as New
- Bookmark
- Subscribe
- Mute
- Subscribe to RSS Feed
- Permalink
- Report Inappropriate Content
Hi Tamil,
It is not possible to apply color for a portion of a string in a cell, for this you need to use two columns one for symbol and another for Number.
Hope this helps you.
Regards,
Jagan.
- Mark as New
- Bookmark
- Subscribe
- Mute
- Subscribe to RSS Feed
- Permalink
- Report Inappropriate Content
Thanks Jagan. The above one is a sample and the chart looks neat. But, I have more than 30 columns and 50 rows in my original table. I have attached snap shot for your reference. I have tried to create a new column already like you said. But that is also not nice. Do you have any idea to make the table view better.?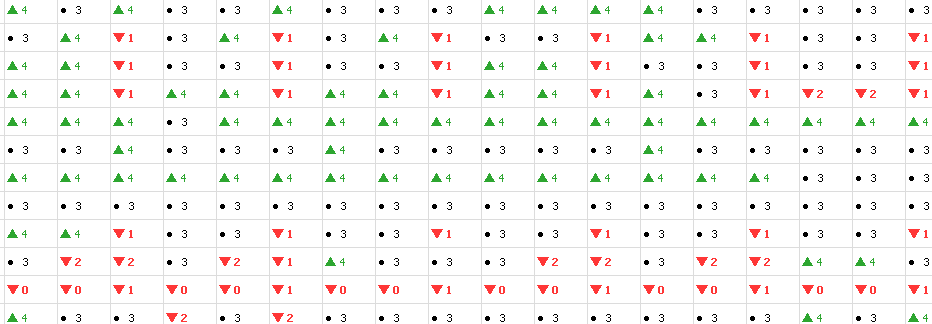
- Mark as New
- Bookmark
- Subscribe
- Mute
- Subscribe to RSS Feed
- Permalink
- Report Inappropriate Content
Hi,
No other way, either you should drop symbols or numbers or you need to create two columns one for symbol and another for Number.
Please find attached file for solution.
Regards,
Jagan.
- Mark as New
- Bookmark
- Subscribe
- Mute
- Subscribe to RSS Feed
- Permalink
- Report Inappropriate Content
From a design point of view, with this many cells I would consider using a background color of light shades of gray/green/red with black text and eliminate the arrows.