Unlock a world of possibilities! Login now and discover the exclusive benefits awaiting you.
- Qlik Community
- :
- All Forums
- :
- QlikView App Dev
- :
- Column in chart that reflects names of other colum...
Options
- Subscribe to RSS Feed
- Mark Topic as New
- Mark Topic as Read
- Float this Topic for Current User
- Bookmark
- Subscribe
- Mute
- Printer Friendly Page
Turn on suggestions
Auto-suggest helps you quickly narrow down your search results by suggesting possible matches as you type.
Showing results for
Partner - Contributor III
2017-08-02
04:02 PM
- Mark as New
- Bookmark
- Subscribe
- Mute
- Subscribe to RSS Feed
- Permalink
- Report Inappropriate Content
Column in chart that reflects names of other columns in chart
Hi,
I have a chart in QlikView that is similar to the chart below but with more columns. What I am trying to do is create the column highlighted in yellow. I want to list the column headers where the value is greater than 0. The expressions for the columns are below.
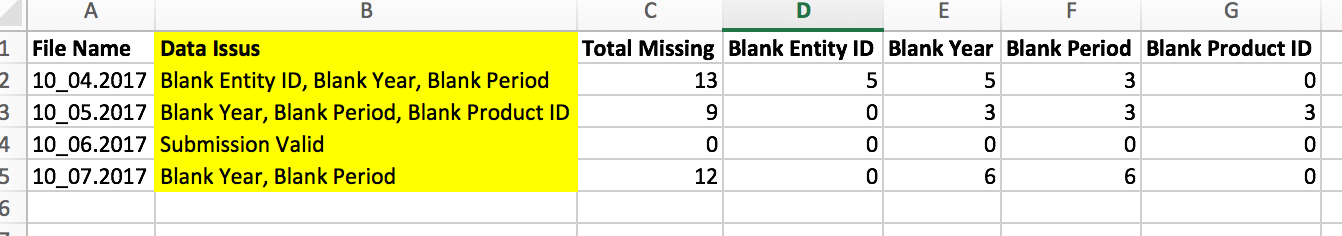
Blank Entity ID: sum([_Null Entity ID]
Blank Year: sum([_Null Year]
Blank Period: sum([_Null Period]
Blank Product ID: sum([_Null Product ID]
Thank you!
448 Views
3 Replies
2017-08-02
10:05 PM
- Mark as New
- Bookmark
- Subscribe
- Mute
- Subscribe to RSS Feed
- Permalink
- Report Inappropriate Content
You mean to say you need to fetch the label names of expression when >0 of your metric. Isn't it ??
Best Anil, When applicable please mark the correct/appropriate replies as "solution" (you can mark up to 3 "solutions". Please LIKE threads if the provided solution is helpful
410 Views
Partner - Specialist III
2017-08-02
11:58 PM
- Mark as New
- Bookmark
- Subscribe
- Mute
- Subscribe to RSS Feed
- Permalink
- Report Inappropriate Content
HI Hannah,
May be below expression help you.
if(is null(Column(2),[Data Issues],'Value')
Thanks,
Arvind Patil
410 Views
Partner - Contributor III
2017-08-03
09:59 AM
Author
- Mark as New
- Bookmark
- Subscribe
- Mute
- Subscribe to RSS Feed
- Permalink
- Report Inappropriate Content
yes
410 Views