Unlock a world of possibilities! Login now and discover the exclusive benefits awaiting you.
- Qlik Community
- :
- All Forums
- :
- QlikView App Dev
- :
- Columns Not Adding Correctly
- Subscribe to RSS Feed
- Mark Topic as New
- Mark Topic as Read
- Float this Topic for Current User
- Bookmark
- Subscribe
- Mute
- Printer Friendly Page
- Mark as New
- Bookmark
- Subscribe
- Mute
- Subscribe to RSS Feed
- Permalink
- Report Inappropriate Content
Columns Not Adding Correctly
Hello,
I have a quick question that I'm hoping the community can help me with. Attached is a screen shot of a table that I exported to Excel. If you add the columns in the 'Current' column, the total at the bottom of that column is NOT correct. I manually added the 'Should Be' column to show what the total should be. Is there a reason this table is behaving like this?
Any information would be greatly appreciated!
- « Previous Replies
-
- 1
- 2
- Next Replies »
- Mark as New
- Bookmark
- Subscribe
- Mute
- Subscribe to RSS Feed
- Permalink
- Report Inappropriate Content
The problem would be stemming from how you have your expression written, but without knowing anything about your chart, it's impossible to tell what it is exactly.
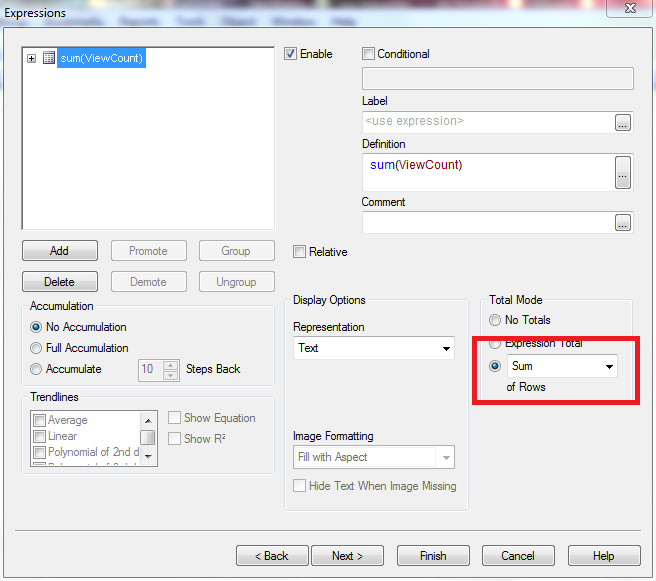
Or, if you're using a straight table, you can change the total from Expression Total to Sum of Rows:
- Mark as New
- Bookmark
- Subscribe
- Mute
- Subscribe to RSS Feed
- Permalink
- Report Inappropriate Content
Nicole,
I already did what you suggested to get the number right within the Straight Table. Now the issue that I have is that I need that total outside of the Straight Table and they aren't matching. Any ideas?
- Mark as New
- Bookmark
- Subscribe
- Mute
- Subscribe to RSS Feed
- Permalink
- Report Inappropriate Content
perhaps you have to uncheck "Suppress when value is null" in dimension tab and/or "Suppress missing" / "Suppress 0 values" in presentation tab
- Mark as New
- Bookmark
- Subscribe
- Mute
- Subscribe to RSS Feed
- Permalink
- Report Inappropriate Content
What do you mean outside of the straight table? In a text box? If that's the case, you'll need to tell me your dimensions and expression.
- Mark as New
- Bookmark
- Subscribe
- Mute
- Subscribe to RSS Feed
- Permalink
- Report Inappropriate Content
Nicole,
That is correct. I am going to need that number for a formula that is in a text box. It looks like all of the columns aren't adding correctly. If you look at the screen shot, column B is just a simple Total Sales column, although I am using Comparative Analysis. Here is the formula:
({$<Year=Group1::Year, Month=Group1::Month, Quarter=Group1::Quarter, Date=Group1::Date>} Price_Ext)
Any ideas?
Thank you so much!
- Mark as New
- Bookmark
- Subscribe
- Mute
- Subscribe to RSS Feed
- Permalink
- Report Inappropriate Content
Massimo,
I don't believe that Null values have anything to do with the issue, but thanks for your input.
- Mark as New
- Bookmark
- Subscribe
- Mute
- Subscribe to RSS Feed
- Permalink
- Report Inappropriate Content
You probably need to use aggr() in the text box and include the dimensions you have on the chart, so you're final formula should look like this:
sum(aggr(sum({$<Year=Group1::Year, Month=Group1::Month, Quarter=Group1::Quarter, Date=Group1::Date>} Price_Ext), TheFirstDimensionOnYourChart,TheSecondDimensionOnYourChart,etc.))
- Mark as New
- Bookmark
- Subscribe
- Mute
- Subscribe to RSS Feed
- Permalink
- Report Inappropriate Content
Nicole,
I tried using aggr() and I was getting the same results.
Thank you for your suggestions!
- Mark as New
- Bookmark
- Subscribe
- Mute
- Subscribe to RSS Feed
- Permalink
- Report Inappropriate Content
If you can post a .qvw file, I may be able to help you out more...
- « Previous Replies
-
- 1
- 2
- Next Replies »