Unlock a world of possibilities! Login now and discover the exclusive benefits awaiting you.
- Qlik Community
- :
- All Forums
- :
- QlikView App Dev
- :
- Re: Combo Chart
- Subscribe to RSS Feed
- Mark Topic as New
- Mark Topic as Read
- Float this Topic for Current User
- Bookmark
- Subscribe
- Mute
- Printer Friendly Page
- Mark as New
- Bookmark
- Subscribe
- Mute
- Subscribe to RSS Feed
- Permalink
- Report Inappropriate Content
Combo Chart
Hi all,
LOAD * INLINE [
Company, Area, Yes, NO, ID2
Test, AAA, 20, 15, 0
Test, AAA, 23, 16, 1
Test, AAA, 28, 17, 2
Test, AAA, 33, 18, 3
Test, AAA, 38, 19, 4
Test, AAA, 43, 20, 5
Test, AAA, 48, 21, 6
Test, BBB, 53, 20, 7
Test, BBB, 58, 18, 8
Test, BBB, 63, 16, 9
Test, BBB, 68, 14, 10
Test, BBB, 73, 12, 11
Test, BBB, 78, 10, 12
Test, BBB, 83, 8, 13
Test, CCC, 88, 6, 14
Test, CCC, 93, 4, 15
Test, CCC, 98, 2, 16
Test, CCC, 103, 0, 17
Test, CCC, 108, 0, 18
Test, CCC, 113, 0, 19
Test, CCC, 118, 0, 20
];
By using above data is it possible to show chart like below
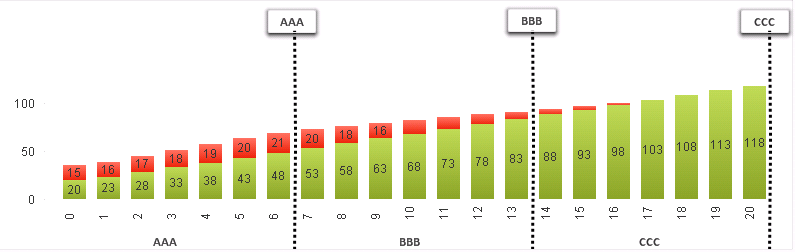
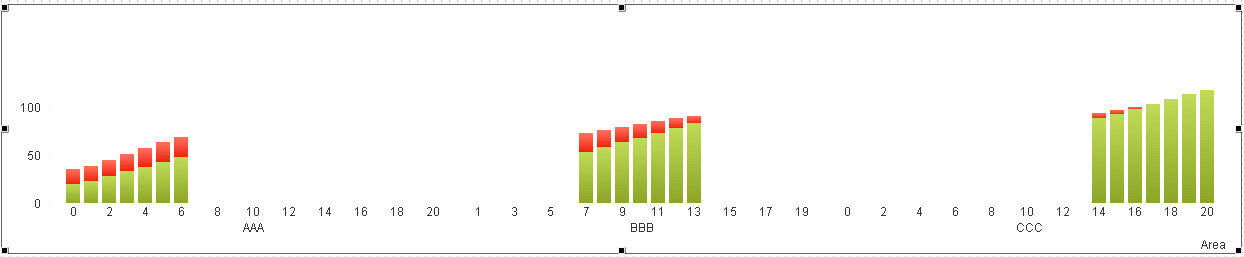
I m not able get it , coming like below and also idont have idea how to create those reference liness
Did any one created this kind of chart.
- « Previous Replies
-
- 1
- 2
- Next Replies »
Accepted Solutions
- Mark as New
- Bookmark
- Subscribe
- Mute
- Subscribe to RSS Feed
- Permalink
- Report Inappropriate Content
Slight improvement by moving the reference lines between the two bars
- Mark as New
- Bookmark
- Subscribe
- Mute
- Subscribe to RSS Feed
- Permalink
- Report Inappropriate Content
Can you please provide the Expression, Which you taken over there?
- Mark as New
- Bookmark
- Subscribe
- Mute
- Subscribe to RSS Feed
- Permalink
- Report Inappropriate Content
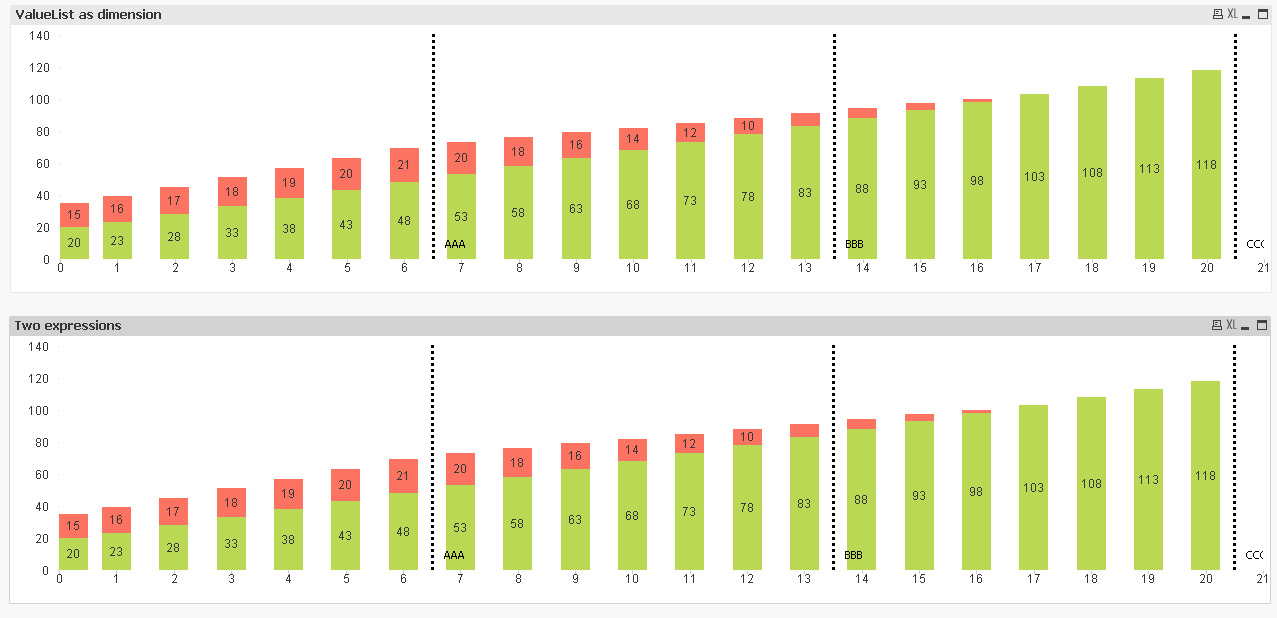
Normal sum only, with stacked one
- Mark as New
- Bookmark
- Subscribe
- Mute
- Subscribe to RSS Feed
- Permalink
- Report Inappropriate Content
This is the closed I managed to get with 5-10 minutes of play around with this. I am sure you can further fine tune this, but see if this is close to what you want
- Mark as New
- Bookmark
- Subscribe
- Mute
- Subscribe to RSS Feed
- Permalink
- Report Inappropriate Content
Added another way to do this without using valuelist

- Mark as New
- Bookmark
- Subscribe
- Mute
- Subscribe to RSS Feed
- Permalink
- Report Inappropriate Content
The Reason is It's not possible with Two dimensions as you expected. Work around Try with Sunny T Solution. I am sure, I've read same kind of thread. I didn't remember his name. I think Manish Kachhia posted the similar. Hope he will explain you. Anyway, Once i reach i might can share that Application with you 
Updated: Subba Reddy, Please find the link which Manish Provides the URL. Hope you will clear on this. And Thanks Manish for remind again
- Mark as New
- Bookmark
- Subscribe
- Mute
- Subscribe to RSS Feed
- Permalink
- Report Inappropriate Content
Slight improvement by moving the reference lines between the two bars
- Mark as New
- Bookmark
- Subscribe
- Mute
- Subscribe to RSS Feed
- Permalink
- Report Inappropriate Content
Sunny, What you added from Reference Line?
- Mark as New
- Bookmark
- Subscribe
- Mute
- Subscribe to RSS Feed
- Permalink
- Report Inappropriate Content
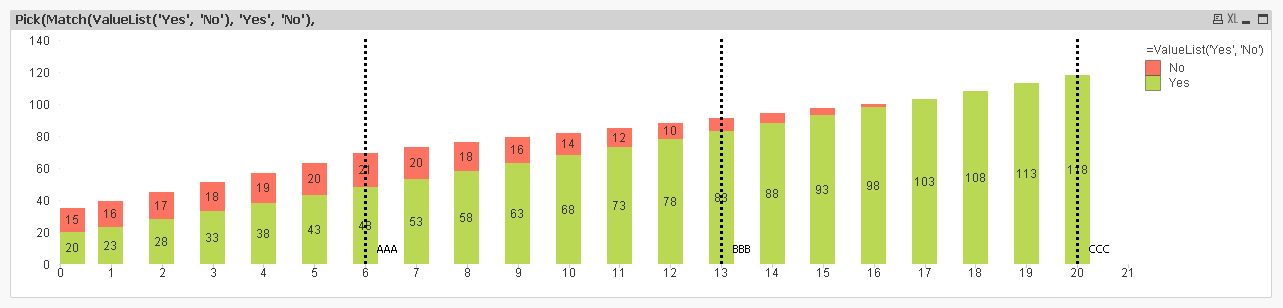
May be like this .
Check and let me know
-Nagarjun
- Mark as New
- Bookmark
- Subscribe
- Mute
- Subscribe to RSS Feed
- Permalink
- Report Inappropriate Content
Hoiw to add reference line?
- « Previous Replies
-
- 1
- 2
- Next Replies »