Unlock a world of possibilities! Login now and discover the exclusive benefits awaiting you.
- Qlik Community
- :
- All Forums
- :
- QlikView App Dev
- :
- Combo chart issue
- Subscribe to RSS Feed
- Mark Topic as New
- Mark Topic as Read
- Float this Topic for Current User
- Bookmark
- Subscribe
- Mute
- Printer Friendly Page
- Mark as New
- Bookmark
- Subscribe
- Mute
- Subscribe to RSS Feed
- Permalink
- Report Inappropriate Content
Combo chart issue
Hello,
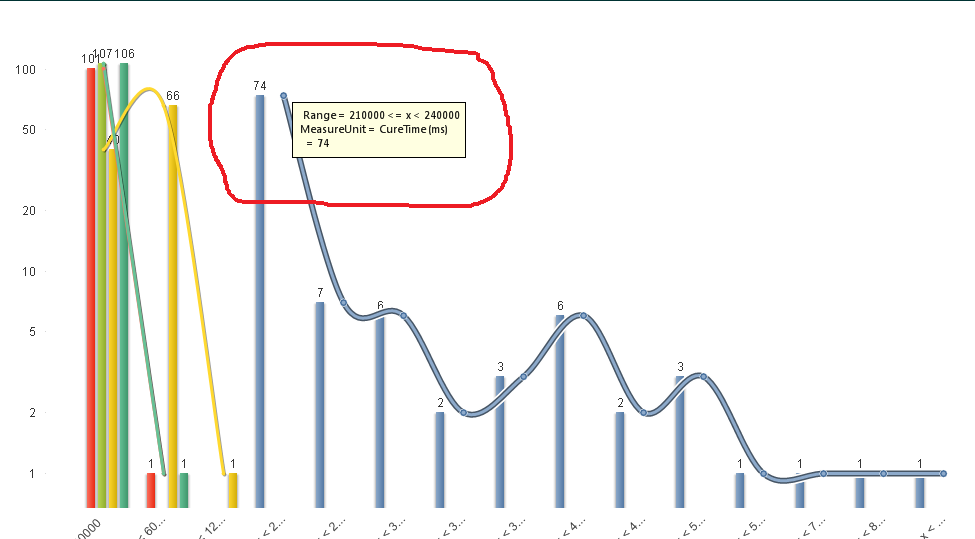
Please find the below image or attached image. I've taken combo chart with 2 dimensions and the expression is Count(Value). For particular expression i'm ploting bar chart, line chart. i.e In Display Options i check Bar, Symbol (Dots), Line (Smooth), Values on Data points. If you see image the line and bar chart are not aligning together,but the values are same. You can see the value for bar chart directly in the chart and for line you can see in mouse over box. Please help me what is the issue. I want to align bar, line & dots together at same point of there values.
- Mark as New
- Bookmark
- Subscribe
- Mute
- Subscribe to RSS Feed
- Permalink
- Report Inappropriate Content
Hello Friends,
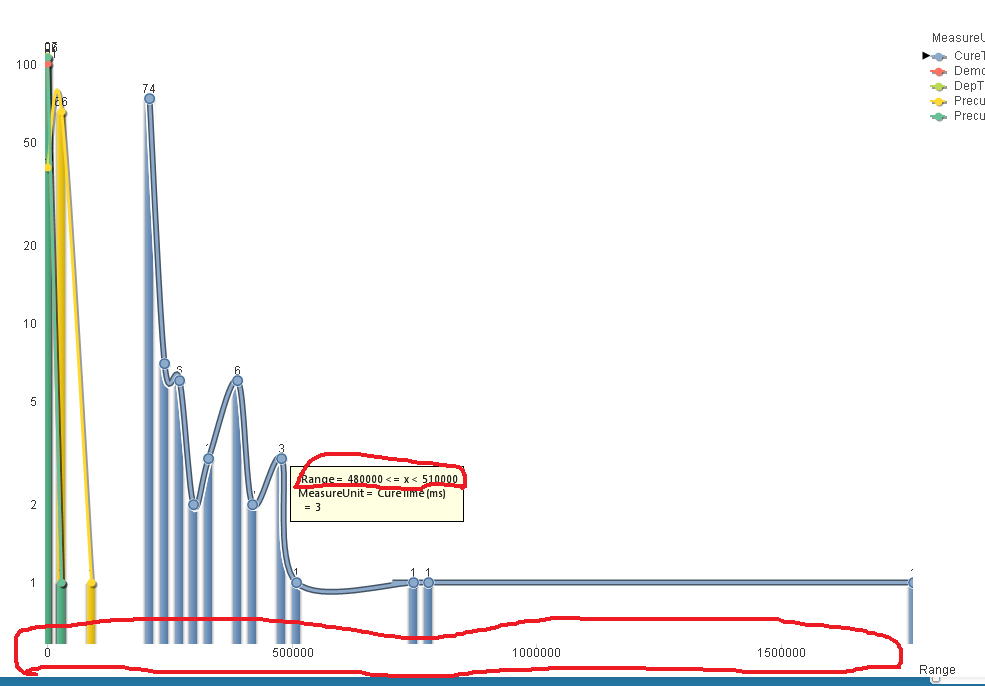
I got the solution for above one. But i need little bit help from you again. If you see in above attach image. My First dimension value is Range i.e 2100000 <=X < 240000. This means i'm developed my first dimension using class interval function. To solve my above post problem, i just went to Chart Properties -> Axes -> checked the Contiuous and Forced 0, that's it my above problem has been solved. But new problem has been started here. I'm not able to see Range value display it shows me the values directly. Please the below or attach image.
- Mark as New
- Bookmark
- Subscribe
- Mute
- Subscribe to RSS Feed
- Permalink
- Report Inappropriate Content
anybody can help me..