Unlock a world of possibilities! Login now and discover the exclusive benefits awaiting you.
- Qlik Community
- :
- All Forums
- :
- QlikView App Dev
- :
- Comparing Cohort datasets across a standard manufa...
- Subscribe to RSS Feed
- Mark Topic as New
- Mark Topic as Read
- Float this Topic for Current User
- Bookmark
- Subscribe
- Mute
- Printer Friendly Page
- Mark as New
- Bookmark
- Subscribe
- Mute
- Subscribe to RSS Feed
- Permalink
- Report Inappropriate Content
Comparing Cohort datasets across a standard manufactured time dimension
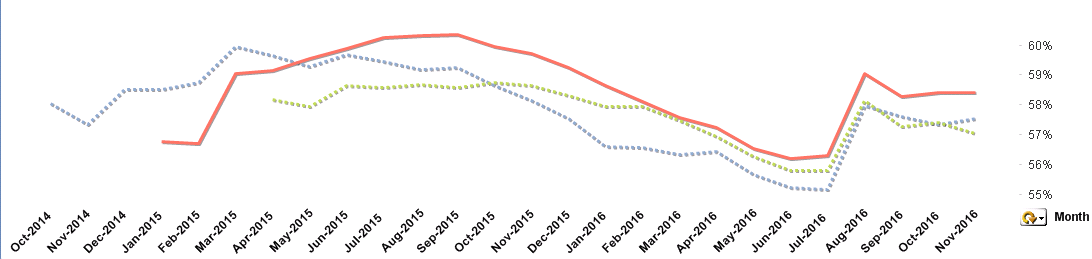
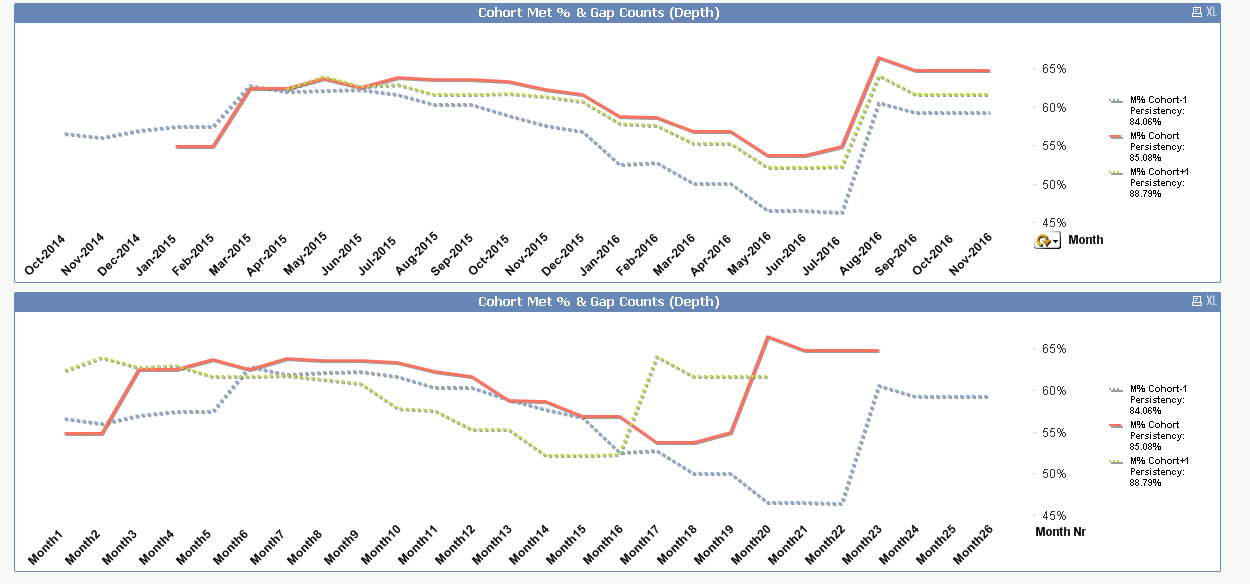
I've created a cohort report that tracks performance of each cohort population across calendar months (DIM). My Selected Cohort time frame is based on a dynamic range selected by the user (2 manufactured DIM pick lists), limited to a Month-Year combination. In this example, Jan-2015-Mar-2015. Using variables, I then calculate the previous and future cohorts populations based on start/end of the selected cohort and number of months in that selected range. In this example, Cohort-1 is manufactured to be Oct-2014 thru Dec-2014 and Cohort+1 is Apr-2015 thru Jun-2015.
As seen below, Cohort-1 has 26 time based metrics, Cohort has 23, and Cohort+1 has 20.
I'd like to time shift the graphic to a generic time definition of Month1, Month2, Month3 etc for each cohort. If I can make this happen, the user can then see their performance by cohort population against all 3 cohorts without the need to visually time-shift each line to the left.
The desired view is the snapshot below but left justified across a generic Month1, Month2, Month3... axis and a value for all 3 cohorts in the first manufactured dim of Month1 thru Month20, then it would be 2 populations for another 3 months, and lastly a single population for the remaining 3 months (Month26).
Thoughts on how I might make this happen would be greatly appreciated!
My Set Expression for Cohort:
// Count of completed metrics
Count(
{<
Eligibility = {'E'},
[Met Status] = {'M'},
[Report Date] = {"$(='>=' & Date($(vCS),'YYYY-MM'))"},
[Assessment Date] = {">=$(=$(vCS)) <=$(=$(vCE))"}
>}
MET_CNT)
/
// Count of total possible metrics to be completed
Count(
{<
Eligibility = {'E'},
[Report Date] = {"$(='>=' & Date($(vCS),'YYYY-MM'))"},
[Assessment Date] = {">=$(=$(vCS)) <=$(=$(vCE))"}
>}
CNT)
//$(vCS) Cohort Start variable based on picklist value chosen by user
//$(vCE) Cohort End variable based on picklist value chosen by user
//[Report Date] is current DIM used to render x-axis
//[Assessment Date] is used to ID the cohort population in conjunction with the selected cohort range
Attaching limited data App
Accepted Solutions
- Mark as New
- Bookmark
- Subscribe
- Mute
- Subscribe to RSS Feed
- Permalink
- Report Inappropriate Content
- Mark as New
- Bookmark
- Subscribe
- Mute
- Subscribe to RSS Feed
- Permalink
- Report Inappropriate Content
So you won't be using Month as your dimension in the case where you want to shift to generic time, right? I am thinking of using ValueLoop() function to create a dimension and some create a measure based on that. I am not 100% sure how this can work, but if you can provide a sample, we can play around with it to see if we can make it work.
Best,
Sunny
- Mark as New
- Bookmark
- Subscribe
- Mute
- Subscribe to RSS Feed
- Permalink
- Report Inappropriate Content
Yes Sunny, I will not/can not use native Month/Year values as a visual time dimension given the lag in each cohort population.
There will never be more than 27 distinct Month/Year periods in the data model. But the span of the cohort range could be anything from a single month to 27 months in theory. Likely cohort populations will be quarterly however.
- Mark as New
- Bookmark
- Subscribe
- Mute
- Subscribe to RSS Feed
- Permalink
- Report Inappropriate Content
Something like this?
- Mark as New
- Bookmark
- Subscribe
- Mute
- Subscribe to RSS Feed
- Permalink
- Report Inappropriate Content
That looks exactly like what I was hoping to deliver!!!
What a simple solution as well, a calculated DIM using Rank. You ROCK!!!
- Mark as New
- Bookmark
- Subscribe
- Mute
- Subscribe to RSS Feed
- Permalink
- Report Inappropriate Content
Not sure if you saw the expression or not, but expressions are sort of messy 
- Mark as New
- Bookmark
- Subscribe
- Mute
- Subscribe to RSS Feed
- Permalink
- Report Inappropriate Content
As a result of what they are doing or just my syntax?
- Mark as New
- Bookmark
- Subscribe
- Mute
- Subscribe to RSS Feed
- Permalink
- Report Inappropriate Content
Well, I changed them for the second and third expression.... So because of what you needed, I had to make them quite messy. Original expressions were okay
- Mark as New
- Bookmark
- Subscribe
- Mute
- Subscribe to RSS Feed
- Permalink
- Report Inappropriate Content
Sorry, Only looked at the 1st expression. I'll dive in deeper as I migrate this to my live App.
Given what it is trying to do, define the laws of time, I'd suspect "messy" should be expected anyway 
Regardless, Fantastic solution to a problem many who are challenged with Cohort Reporting, intertwined with Analytics, will likely be benefited.