Unlock a world of possibilities! Login now and discover the exclusive benefits awaiting you.
- Qlik Community
- :
- All Forums
- :
- QlikView App Dev
- :
- Comparing two different year ?
- Subscribe to RSS Feed
- Mark Topic as New
- Mark Topic as Read
- Float this Topic for Current User
- Bookmark
- Subscribe
- Mute
- Printer Friendly Page
- Mark as New
- Bookmark
- Subscribe
- Mute
- Subscribe to RSS Feed
- Permalink
- Report Inappropriate Content
Comparing two different year ?
need to compare two different years ( 2011 and 2010) using variables.
Can any one help.
tnx
- Tags:
- new_to_qlikview
- « Previous Replies
- Next Replies »
Accepted Solutions
- Mark as New
- Bookmark
- Subscribe
- Mute
- Subscribe to RSS Feed
- Permalink
- Report Inappropriate Content
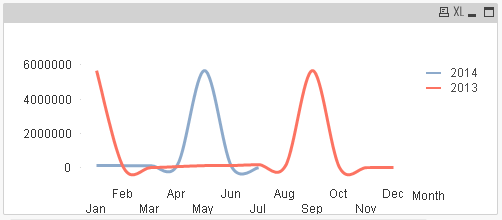
After taking line chart and adding Dimension and Expression
Dimension:-Month
Previous Year
Sum({<Year = {'$(=Max(Year)-1)'}>}Sales)
And
Current Year
Sum({<Year = {'$(=Max(Year))'}>}Sales)
See the snap shot of the Line chart with the Month Dimension and Expression for current and previous
- Mark as New
- Bookmark
- Subscribe
- Mute
- Subscribe to RSS Feed
- Permalink
- Report Inappropriate Content
SUM({<Year = {'$(=Max(Year))'}>}Sales) //Current Year
and
SUM({<Year = {'$(=Max(Year)-1)'}>}Sales) // Previous Year
Now you can compare them
- Mark as New
- Bookmark
- Subscribe
- Mute
- Subscribe to RSS Feed
- Permalink
- Report Inappropriate Content
Write a variable like
let vCurrYear = 2011
Let vPrevYear = 2010
and in expression use this variavbles
- Mark as New
- Bookmark
- Subscribe
- Mute
- Subscribe to RSS Feed
- Permalink
- Report Inappropriate Content
Update now check
If you want to compare only 2011 and 2010
then write
2011
Sum({<Year = {'$(=Max(Year)-3)'}>}Sales)
And
2010
Sum({<Year = {'$(=Max(Year)-4)'}>}Sales)
- Mark as New
- Bookmark
- Subscribe
- Mute
- Subscribe to RSS Feed
- Permalink
- Report Inappropriate Content
Thanks .
But i would like to depict them on line graphs ?
- Mark as New
- Bookmark
- Subscribe
- Mute
- Subscribe to RSS Feed
- Permalink
- Report Inappropriate Content
Let us know your requirement with dummy data...
- Mark as New
- Bookmark
- Subscribe
- Mute
- Subscribe to RSS Feed
- Permalink
- Report Inappropriate Content
Thanks
i was thinking just like this :
http://community.qlik.com/blogs/qlikviewdesignblog/2014/03/03/ytd
- Mark as New
- Bookmark
- Subscribe
- Mute
- Subscribe to RSS Feed
- Permalink
- Report Inappropriate Content
Create a line chart
Dimension
Month
Expressions
SUM({<Year = {'$(=Max(Year))'}>}Sales) //Current Year
SUM({<Year = {'$(=Max(Year)-1)'}>}Sales) // Previous Year
- Mark as New
- Bookmark
- Subscribe
- Mute
- Subscribe to RSS Feed
- Permalink
- Report Inappropriate Content
So, is there anything specific there in the blog that you don't understand? Otherwise, it explains very nicely, right?
- Mark as New
- Bookmark
- Subscribe
- Mute
- Subscribe to RSS Feed
- Permalink
- Report Inappropriate Content
You can make chart with any dimension like
Take a line chart
Dimension :-Year ,Month
Expression1:- for 2011
Sum({<Year = {'$(=Max(Year)-3)'}>}Sales)
And
Expression2:- for 2010
Sum({<Year = {'$(=Max(Year)-4)'}>}Sales)
If you want to plot chart for current year and previous year then use
Dimension:-Month
Previous Year
Sum({<Year = {'$(=Max(Year)-1)'}>}Sales)
And
Current Year
Sum({<Year = {'$(=Max(Year))'}>}Sales)
- « Previous Replies
- Next Replies »