Unlock a world of possibilities! Login now and discover the exclusive benefits awaiting you.
- Qlik Community
- :
- All Forums
- :
- QlikView App Dev
- :
- Conditional Color Change on Bar Chart
- Subscribe to RSS Feed
- Mark Topic as New
- Mark Topic as Read
- Float this Topic for Current User
- Bookmark
- Subscribe
- Mute
- Printer Friendly Page
- Mark as New
- Bookmark
- Subscribe
- Mute
- Subscribe to RSS Feed
- Permalink
- Report Inappropriate Content
Conditional Color Change on Bar Chart
Hi All,
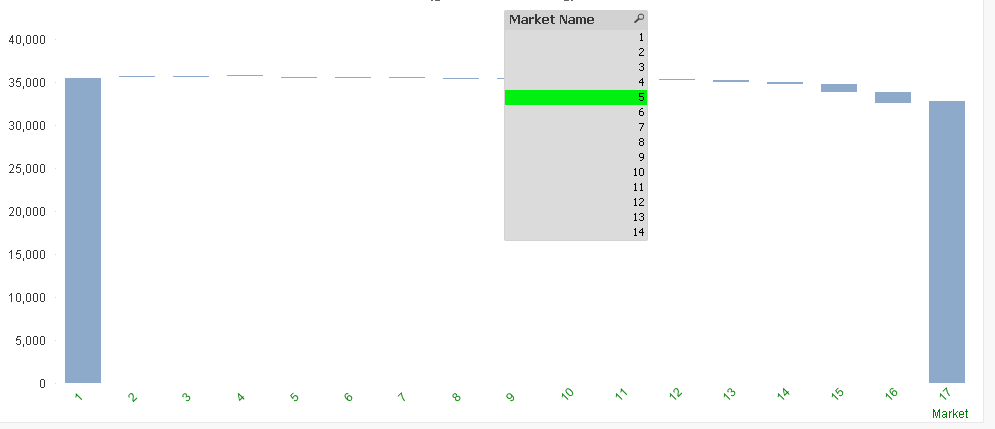
I have a bar chart as Market as dimentions and sum(sales) as expression and I have one more list box called Market Name.
My requirement is if i check 5 on list box only 5 should highlighted with some different color or bold,
I have managed to change the color of all markets but not the particular one.
if(GetFieldSelections([Market Name])= '5', Green())
in this case only 5 should display as green and not all the markets
Thanks
Varun
- Tags:
- new_to_qlikview
- Mark as New
- Bookmark
- Subscribe
- Mute
- Subscribe to RSS Feed
- Permalink
- Report Inappropriate Content
Right this on the Expression background colour attribute
- Mark as New
- Bookmark
- Subscribe
- Mute
- Subscribe to RSS Feed
- Permalink
- Report Inappropriate Content
Hi Sujeet
Thanks for ur reply.
my requirement is if select 5 on list box only five get highlighted on bar chart Y axis
Thanks
Varun
- Mark as New
- Bookmark
- Subscribe
- Mute
- Subscribe to RSS Feed
- Permalink
- Report Inappropriate Content
Use expression like:
=Sum({<[Market Name]>} Sales)
And then your expression if(GetFieldSelections([Market Name])= '5', Green()) should work the way you want.
Edit: Corrected field name
- Mark as New
- Bookmark
- Subscribe
- Mute
- Subscribe to RSS Feed
- Permalink
- Report Inappropriate Content
Hello Tresco,
Thanks for ur reply
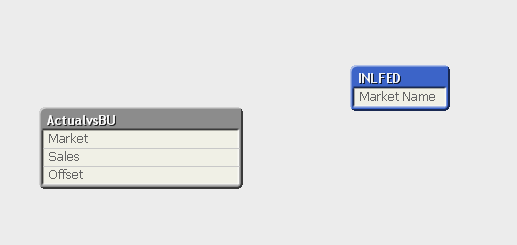
PFA data model.
Bar chart and list box don't have any link.
Thanks
Varun
- Mark as New
- Bookmark
- Subscribe
- Mute
- Subscribe to RSS Feed
- Permalink
- Report Inappropriate Content
In that case, it should work without that set expression inclusion. Can you share a sample qvw that demonstrates the issue?
- Mark as New
- Bookmark
- Subscribe
- Mute
- Subscribe to RSS Feed
- Permalink
- Report Inappropriate Content
Please find the attached qvw
- Mark as New
- Bookmark
- Subscribe
- Mute
- Subscribe to RSS Feed
- Permalink
- Report Inappropriate Content
I tried with background color.
Exp: If([Market Name]=1 and Market=1, Red(), Green())
You have to modify accordingly.
PFA
Update: to make it dynamic use something like: If([Market Name]= Market, Red(), Green())