Unlock a world of possibilities! Login now and discover the exclusive benefits awaiting you.
- Qlik Community
- :
- All Forums
- :
- QlikView
- :
- Conditional Show Button, if chart/ straight table ...
- Subscribe to RSS Feed
- Mark Topic as New
- Mark Topic as Read
- Float this Topic for Current User
- Bookmark
- Subscribe
- Mute
- Printer Friendly Page
- Mark as New
- Bookmark
- Subscribe
- Mute
- Subscribe to RSS Feed
- Permalink
- Report Inappropriate Content
Conditional Show Button, if chart/ straight table active
Hi guys
Im sure you can help on this matter quite quickly.
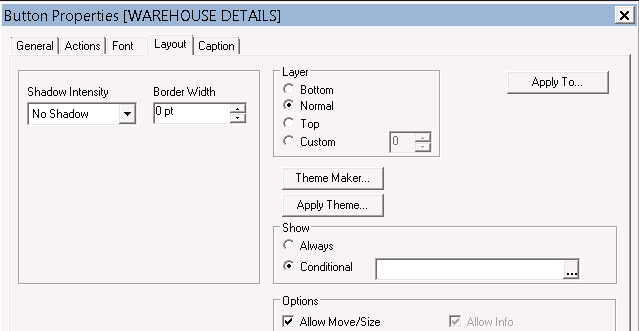
I have some buttons in my app, to show additional informations (dim) for specific straigh table. My target is to show the buttons just if the table (object id, CH14) is active.
how should the conditional expression look like in the button properties?
Many thanks 
rgs
- Tags:
- new_to_qlikview
- Mark as New
- Bookmark
- Subscribe
- Mute
- Subscribe to RSS Feed
- Permalink
- Report Inappropriate Content
There's no activation event for charts. So it's impossible to determine when a chart becomes active. If you already have an action to show the chart using a show condition for that chart then you can use the same condition expression for your text box.
An alternative is to enter the additional information in the Help Text on the Caption tab of the charts properties window. That text will show as a popup if you hover the mouse over the question mark in the caption and it will show in a popup info window if you click the question mark.
talk is cheap, supply exceeds demand
- Mark as New
- Bookmark
- Subscribe
- Mute
- Subscribe to RSS Feed
- Permalink
- Report Inappropriate Content
i would suggest creating buttons or text boxes, that whn clicked set a variable. You will then set up the condition on your chart to only show based on the variable value - this will then only show the chart if you click on the button/text box. Once yopu click on another button/text box, the chart that was perviously showing would no longer display and another chart would
- Mark as New
- Bookmark
- Subscribe
- Mute
- Subscribe to RSS Feed
- Permalink
- Report Inappropriate Content
Dear Roberto,
Kindly find attached App, I hope you are looking for that one.
Kind regards,
Ishfaque Ahmed
- Mark as New
- Bookmark
- Subscribe
- Mute
- Subscribe to RSS Feed
- Permalink
- Report Inappropriate Content
We can't fetch the Active Object ID. So assign the actions to the button.. by setting variable. Use that variable in Hide/Show condition for the other charts.
- Mark as New
- Bookmark
- Subscribe
- Mute
- Subscribe to RSS Feed
- Permalink
- Report Inappropriate Content
my idea was more to show specific buttons according the straight table i have selected. In the graph below is a container which is including 3 straight tables, INV DETAIL, ROC, AVAILABILTIY... Now it would be great to show different buttons on the left side, according the straight table selection. The buttons are actually showing additional data/expressions in the straight table, which the user can select, depending on what he like to see. If the user selects the straight table ROC, i would like to show other buttons, to give some more details on the ROC....
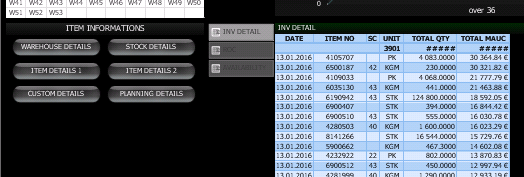
Is herefore really no easy solution? perhaps my explaination on the previous post wasnt proper enough and somebody has an idea, how i could do this
Many thanks