Unlock a world of possibilities! Login now and discover the exclusive benefits awaiting you.
- Qlik Community
- :
- All Forums
- :
- QlikView App Dev
- :
- Conditionally displaying information
- Subscribe to RSS Feed
- Mark Topic as New
- Mark Topic as Read
- Float this Topic for Current User
- Bookmark
- Subscribe
- Mute
- Printer Friendly Page
- Mark as New
- Bookmark
- Subscribe
- Mute
- Subscribe to RSS Feed
- Permalink
- Report Inappropriate Content
Conditionally displaying information
Hi,
I would like to know if we can achieve this function in Qlikview.
Currently, there's a bar graph showing sales by year. Horizontal axis is the year, and volume of total sales (sum of 4 quarters) is displayed by the height of the bars. Now, if I click on a specific year, say 2009, I want the bar graph to expand so that it displays the sales of 4 quarters of 2009 - ie. 4 bars representing a quarter respectively. When I clear, I go back to the yearly (original graph), but if I click on a specific year, I see the 4 quarters of that year. Is there a way to conditionally display that information?
Thanks!
Accepted Solutions
- Mark as New
- Bookmark
- Subscribe
- Mute
- Subscribe to RSS Feed
- Permalink
- Report Inappropriate Content
Yes You can do this. You need to create a Drill group.
To do this go to the dimensions tab of a chart and select "Edit Groups"--"New...".
Then name your group and add the fields to the "Used Fields" list. for your example it would be Year and Quarter. you could go down even farther if need be (e.g. month, day).
Then use this new group as your dimension, and the functionality you described will be there.
- Mark as New
- Bookmark
- Subscribe
- Mute
- Subscribe to RSS Feed
- Permalink
- Report Inappropriate Content
Thank you, it worked!
- Mark as New
- Bookmark
- Subscribe
- Mute
- Subscribe to RSS Feed
- Permalink
- Report Inappropriate Content
Hello!
You can try creating a drill down group, were Year and Quarter are the dimensions, so when you select 2009 (in the chart) you get the 4 quarters
Here is an example:
Create a drill down group
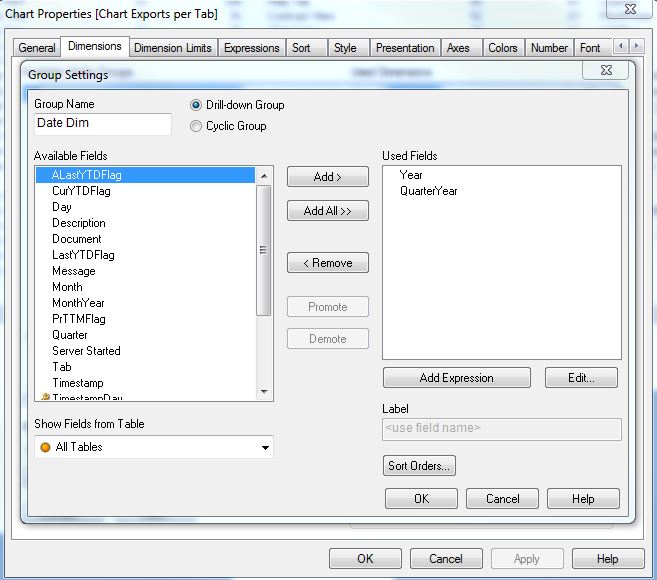
Then use it as a dimension:
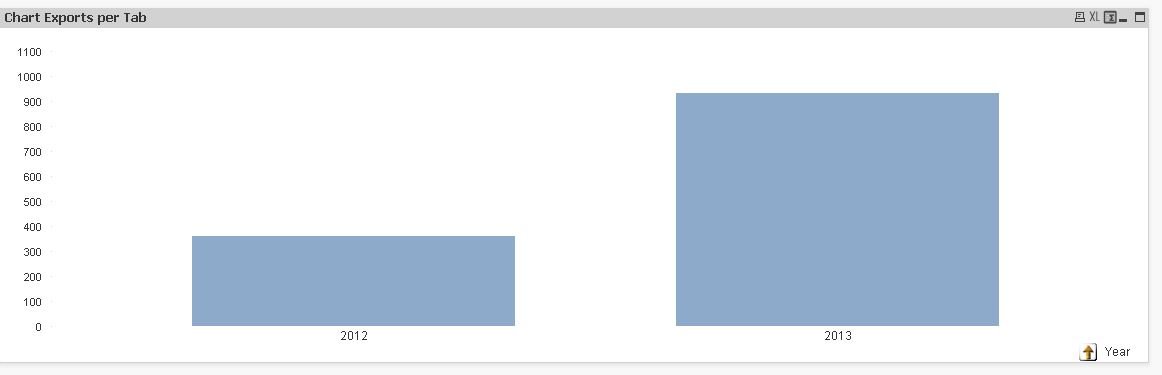
And when you double click in an Year, it takes you to the next level (Quarter Year)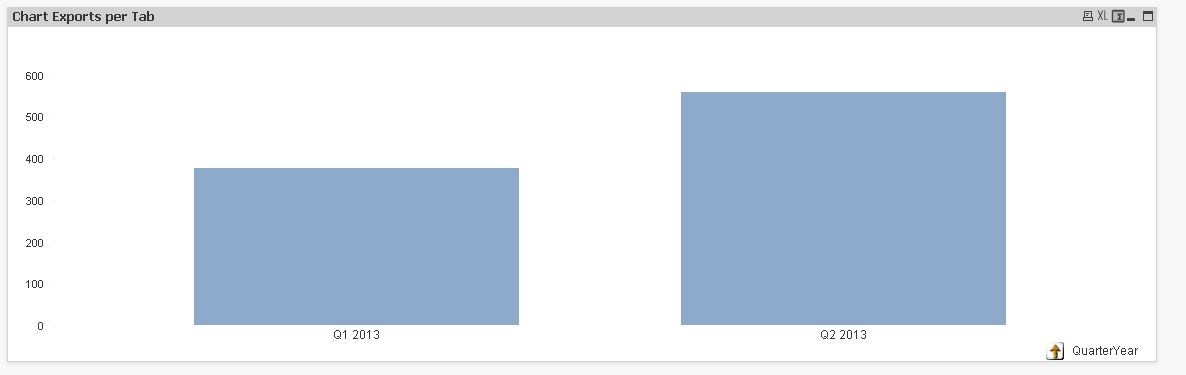
Let me know if this helped
Regards.
Pablo