Unlock a world of possibilities! Login now and discover the exclusive benefits awaiting you.
- Qlik Community
- :
- All Forums
- :
- QlikView App Dev
- :
- Correlation in Chart
- Subscribe to RSS Feed
- Mark Topic as New
- Mark Topic as Read
- Float this Topic for Current User
- Bookmark
- Subscribe
- Mute
- Printer Friendly Page
- Mark as New
- Bookmark
- Subscribe
- Mute
- Subscribe to RSS Feed
- Permalink
- Report Inappropriate Content
Correlation in Chart
Hi,
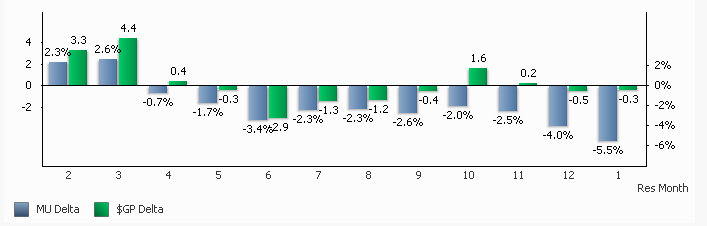
I have a chart with 2 expressions over one dimesion,
i'm trying to show somewhere in the chart the correlation between the 2 expressions-
in the exmple below- what is the correlation between MU Delta and $GP Delta.
is this possible?
Thanks!!
- Mark as New
- Bookmark
- Subscribe
- Mute
- Subscribe to RSS Feed
- Permalink
- Report Inappropriate Content
You may add a text box to display the value =correl([MU Data], [$GP Delta])
Extract from the Qlikview Reference Manual for Correl function is:
correl ([{set_expression}] [ distinct ] [ total [<fld {,fld}>] ] xexpression,
y-expression )
returns the aggregated correlation coefficient for a series of coordinates represented by paired numbers in xexpression
and y-expression iterated over the chart dimension(s). Text values, null values and missing values
in any or both pieces of a data-pair will result in the entire data-pair to be disregarded. See also the rangecorrel(
x-value , y-value { , x-value , y-value}) function.
X-expression and y-expression must not contain aggregation functions, unless these inner aggregations contain
the total qualifier. For more advanced nested aggregations, please use the Advanced Aggregation function in combination with calculated dimensions, see Add calculated dimension... .
This function has the same limitations for nested aggregation as the avg([{set_expression}] [ distinct ] [
total [<fld { , fld } >]] expression) function. The correl function supports Set Analysis and the total qualifier in the same way as the avg([{set_expression}] [ distinct ] [ total [<fld { , fld }
>]] expression) function.
Examples:
correl( Payments, Dates )
correl( A/B, X*Y/3 )
correl( total Payments, Dates )
correl( total <Grp> Payments, Dates)
Hope this helps.
- Mark as New
- Bookmark
- Subscribe
- Mute
- Subscribe to RSS Feed
- Permalink
- Report Inappropriate Content
but the 'MU Delta' and '$GP Delta' are expressions in the chart- not fields,
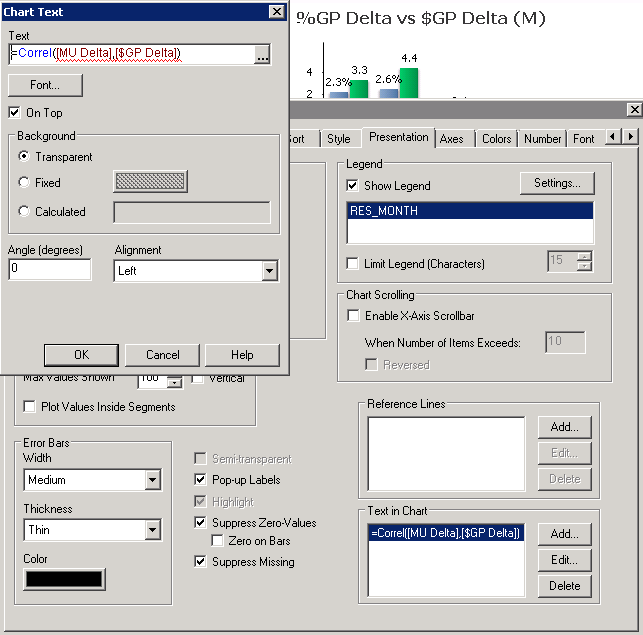
i tried to add in the chart properties: Presentation>Text in Chart: =correl([MU Delta],[$GP Delta])
but it doesnt seem to work.
am I doing somehing wrong?
- Mark as New
- Bookmark
- Subscribe
- Mute
- Subscribe to RSS Feed
- Permalink
- Report Inappropriate Content
Replace [MU Data] and [$GP Delta] with the corresponding expressions in the chart text dialog box by clicking on the ... button.
- Mark as New
- Bookmark
- Subscribe
- Mute
- Subscribe to RSS Feed
- Permalink
- Report Inappropriate Content
of course, i tried that,
the problem is that my expressions include aggregation functions (sum,count),
and i cant find a way to make it work,
also tried with variables but it didnt seem to work...
- Mark as New
- Bookmark
- Subscribe
- Mute
- Subscribe to RSS Feed
- Permalink
- Report Inappropriate Content
A similar experiment is working for me. Try testing the same in a text box first. Text in the box = correl (X-expression, Y-expression). You could include your aggregations, sums, averages, what have yous in these two expressions. Check if the text box displays it correctly. You could then fetch the data from the text box into the chart.
However, given that you seem to want it in the chart itself, and for future use (maybe future use is all that's to hope for, given how belated this reply is):
The linear trendline option does the same in the expressions tab of any chart. Isn't that a direct tool to have exactly what you seek, or I am being too naive in interpreting your situation?
- Mark as New
- Bookmark
- Subscribe
- Mute
- Subscribe to RSS Feed
- Permalink
- Report Inappropriate Content
I think Shiran would like to correlate 2 different selections, but the correlation formula only allows 1 set analysis, you cannot have different set analysis for y-axis and x-axis.
I am having the same problem on how to correlate the 2 expressions.