Unlock a world of possibilities! Login now and discover the exclusive benefits awaiting you.
- Qlik Community
- :
- All Forums
- :
- QlikView App Dev
- :
- Count Acummulated
- Subscribe to RSS Feed
- Mark Topic as New
- Mark Topic as Read
- Float this Topic for Current User
- Bookmark
- Subscribe
- Mute
- Printer Friendly Page
- Mark as New
- Bookmark
- Subscribe
- Mute
- Subscribe to RSS Feed
- Permalink
- Report Inappropriate Content
Count Acummulated
Hi,
I have tried to do the same thing that
http://community.qlik.com/message/665106#665106
But, does't work...
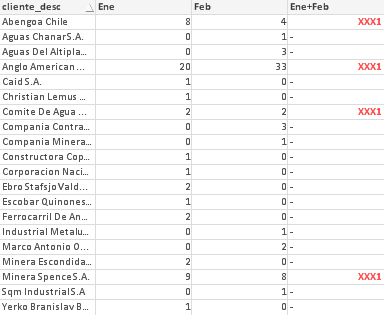
I need that my count be 22 and not 20.
January has 13 registers
February has 11 (2 register that already is in January) so would be 9
13 + 9 = 22...
Thanks!
- Mark as New
- Bookmark
- Subscribe
- Mute
- Subscribe to RSS Feed
- Permalink
- Report Inappropriate Content
if you use "Expression total" for the total calculation, then the number is correct
as there are 20 persons in both months
if you Change to a straight table you may Change to "sum of rows" instead of Expression total and you get your numbers.
in Pivot table you may Change the Expression to
=rangesum(count(distinct (cliente_desc)))
- Mark as New
- Bookmark
- Subscribe
- Mute
- Subscribe to RSS Feed
- Permalink
- Report Inappropriate Content
Hi Rudolf,
Still gives rangesum(count(distinct (cliente_desc))) = 20
The sum has to be 22
13 in january
9 in february.
- Mark as New
- Bookmark
- Subscribe
- Mute
- Subscribe to RSS Feed
- Permalink
- Report Inappropriate Content
in Feb you have only 7 distinct new clients, not 9. so your distinct count is working 
Following 4 client has already registered in Jan.
- Mark as New
- Bookmark
- Subscribe
- Mute
- Subscribe to RSS Feed
- Permalink
- Report Inappropriate Content
I exported Jan (13 registers) and Feb cliente_desc
Feb Appears with 11 registers but 2 repeat registers (Jan). Feb = 9
- Mark as New
- Bookmark
- Subscribe
- Mute
- Subscribe to RSS Feed
- Permalink
- Report Inappropriate Content
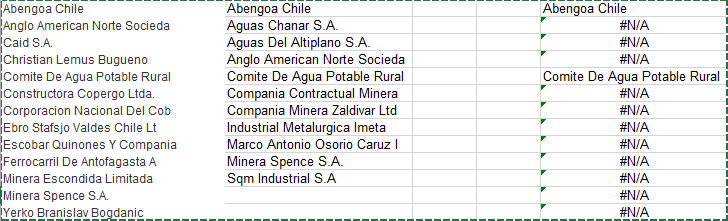
Erdal,
Did you do the same thing. If you export jan and feb and then do lookup fuction in excel. you realize that jan has 13 registers and Feb 9.
- Mark as New
- Bookmark
- Subscribe
- Mute
- Subscribe to RSS Feed
- Permalink
- Report Inappropriate Content
I believe your VLOOKUP in excel is wrong. Check my screenshot you have 4 clients who are in registered in January and appear in February.
PS: Although this is QV forum, this is the problem in your excel formula.
Your VLOOKUP in excel needs to use absolute cell references in table array.
Check this one.