Unlock a world of possibilities! Login now and discover the exclusive benefits awaiting you.
- Qlik Community
- :
- All Forums
- :
- QlikView App Dev
- :
- Count Specific - In line chart
- Subscribe to RSS Feed
- Mark Topic as New
- Mark Topic as Read
- Float this Topic for Current User
- Bookmark
- Subscribe
- Mute
- Printer Friendly Page
- Mark as New
- Bookmark
- Subscribe
- Mute
- Subscribe to RSS Feed
- Permalink
- Report Inappropriate Content
Count Specific - In line chart
Hi all,
I'm trying to show average amounts per time in a line chart by summing the amounts per time and divide it by the number of days. However, something is fishy, pls see below. For instance, When choosing 3 (distinct) dates, these two graphs are showing different values. Seems very odd to me. Any ideas?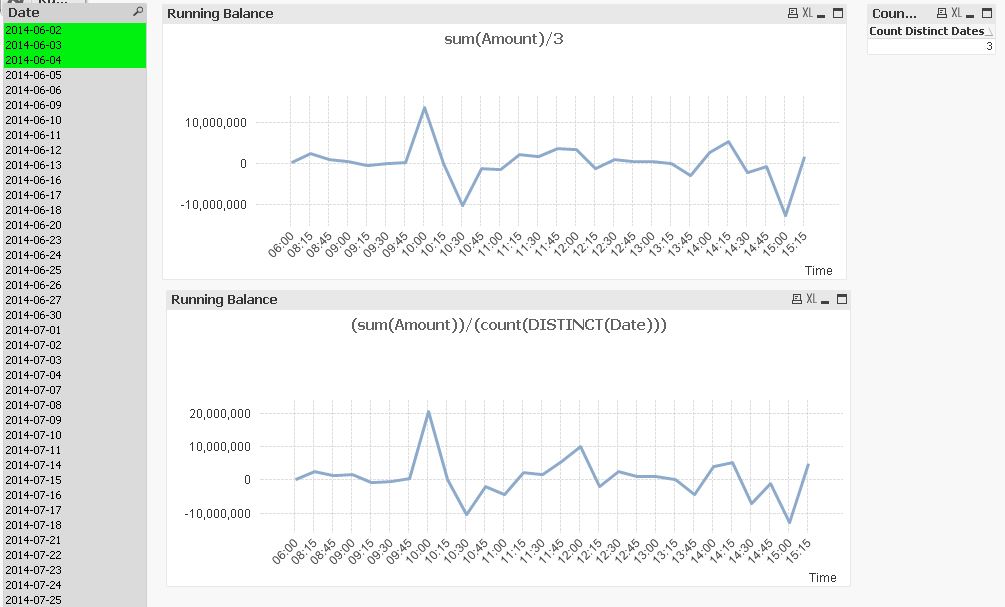
- Tags:
- new_to_qlikview
Accepted Solutions
- Mark as New
- Bookmark
- Subscribe
- Mute
- Subscribe to RSS Feed
- Permalink
- Report Inappropriate Content
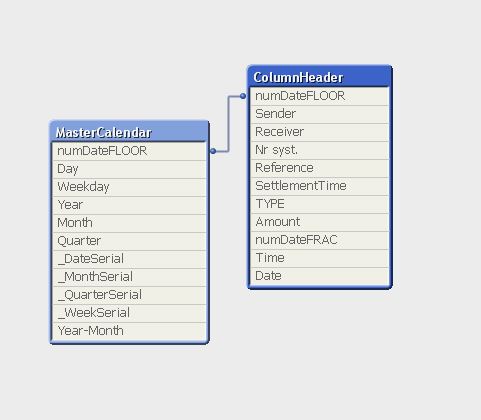
Is your Date field a key field that links one or more tables? If so, qlikview cannot know from which table it should count the Date values. You can get undefined behaviour in that case. The solution is to use another field from the table over which you want to count.
talk is cheap, supply exceeds demand
- Mark as New
- Bookmark
- Subscribe
- Mute
- Subscribe to RSS Feed
- Permalink
- Report Inappropriate Content
Hi Gysbert,
The below Is all I got.
And im counting the Date field.
Thanks in advance,
Olle
Text(Date(SettlementTime, 'YYYY-MM-DD')) As Date
- Mark as New
- Bookmark
- Subscribe
- Mute
- Subscribe to RSS Feed
- Permalink
- Report Inappropriate Content
Found the problem. Issues with the underlying data.
//O