Unlock a world of possibilities! Login now and discover the exclusive benefits awaiting you.
- Qlik Community
- :
- All Forums
- :
- QlikView App Dev
- :
- Count in Line Graph counting incorrectly
- Subscribe to RSS Feed
- Mark Topic as New
- Mark Topic as Read
- Float this Topic for Current User
- Bookmark
- Subscribe
- Mute
- Printer Friendly Page
- Mark as New
- Bookmark
- Subscribe
- Mute
- Subscribe to RSS Feed
- Permalink
- Report Inappropriate Content
Count in Line Graph counting incorrectly
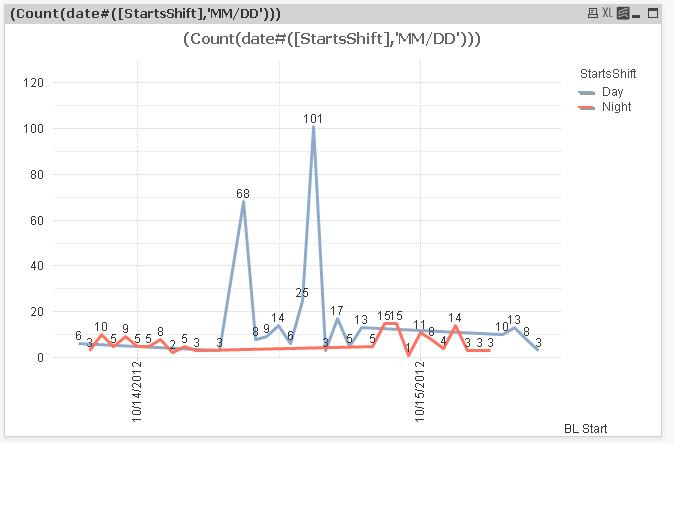
What did I do wrong here? I have a list of activities with start dates 10/12/12 through 11/12/12. When I ask the chart to count the starts on each date, it staggers the graph. There should be only one data point between days, but for some reason it waves. Any body got an idea on this one?
Thanks,
Heydar
- Tags:
- new_to_qlikview
Accepted Solutions
- Mark as New
- Bookmark
- Subscribe
- Mute
- Subscribe to RSS Feed
- Permalink
- Report Inappropriate Content
Your BL Start is still a timestamp. You formatted the field as date (without time), but the internal representation still keeps the time (check the numerical representation e.g. by adding an expression num([BL Start]) to a list box with BL Start.)
Try creating a real date by applying daystart() to your field, maybe like
LOAD
...
Date(daystart([(*)Start]),'DD.MM.YYYY') as [BL Start],
....
Hope this helps,
Stefan