Unlock a world of possibilities! Login now and discover the exclusive benefits awaiting you.
- Qlik Community
- :
- All Forums
- :
- QlikView App Dev
- :
- Count number of duplicate and where they visited?
- Subscribe to RSS Feed
- Mark Topic as New
- Mark Topic as Read
- Float this Topic for Current User
- Bookmark
- Subscribe
- Mute
- Printer Friendly Page
- Mark as New
- Bookmark
- Subscribe
- Mute
- Subscribe to RSS Feed
- Permalink
- Report Inappropriate Content
Count number of duplicate and where they visited?
Hi All,
I would like to seek your advise on the script (please paste here as I am using the personal edition). Thank in advance.
I have a very long list will be only showing a subset over here in table 1 and the answer I am looking at is:
ANSWER
| Row Labels | Shop | Leisure | Drink | Play | Fun | Eat | NO of events |
| A | 3 | 1 | 4 | ||||
| B | 3 | 1 | 4 | ||||
| C | 3 | 1 | 4 | ||||
| D | 2 | 2 | |||||
| E | 2 | 2 | |||||
| F | 2 | 2 | |||||
| G | 1 | 1 |
Table 1
| Customers | Place of visit |
| A | Shop |
| B | Leisure |
| C | Drink |
| E | Play |
| D | Fun |
| F | Eat |
| A | Shop |
| B | Leisure |
| C | Drink |
| E | Play |
| D | Fun |
| F | Eat |
| A | Shop |
| B | Leisure |
| C | Drink |
| A | Play |
| B | Fun |
| C | Eat |
| G | Shop |
- « Previous Replies
-
- 1
- 2
- Next Replies »
- Mark as New
- Bookmark
- Subscribe
- Mute
- Subscribe to RSS Feed
- Permalink
- Report Inappropriate Content
Like this?
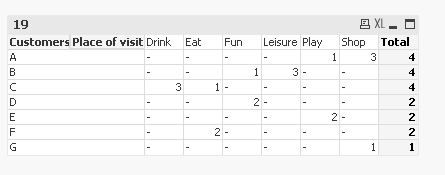
Pivot Table
Dimensions
Customers
Place of visit -> Enable Partial Sum on the presentation tab for this dimension
Expression
Count(Customers)
- Mark as New
- Bookmark
- Subscribe
- Mute
- Subscribe to RSS Feed
- Permalink
- Report Inappropriate Content
I wasn't able to do a sort based on descending order on the column "TOTAL". how to do that?
Also If I want to tabulate the column "TOTAL" into a bar chart like number of time the '1' appear, number of time the '2' appear and so on.
For your kind advise.
- Mark as New
- Bookmark
- Subscribe
- Mute
- Subscribe to RSS Feed
- Permalink
- Report Inappropriate Content
A bar chart like this?
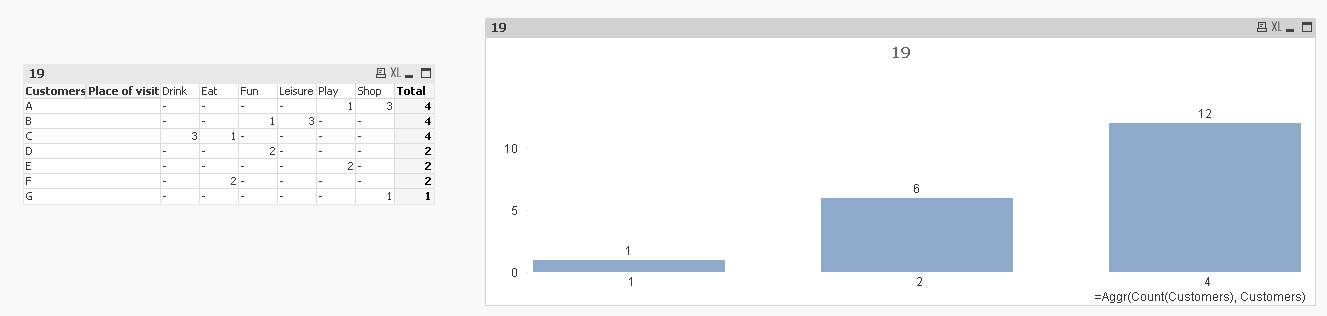
Calculated dimension
=Aggr(Count(Customers), Customers)
Expression:
Count(Customers)
For sorting I will have to play around with the data a little. Would you be able to try this sorting expression (and uncheck all other options)
=Aggr(Count(TOTAL <Customers> Customers), Customers, [Place of visit])
also make sure the order is descending
- Mark as New
- Bookmark
- Subscribe
- Mute
- Subscribe to RSS Feed
- Permalink
- Report Inappropriate Content
for the bar chart, how can I exclude "1" and only show the rest?
- Mark as New
- Bookmark
- Subscribe
- Mute
- Subscribe to RSS Feed
- Permalink
- Report Inappropriate Content
for your advise,pls
- Mark as New
- Bookmark
- Subscribe
- Mute
- Subscribe to RSS Feed
- Permalink
- Report Inappropriate Content
for the bar chart, how can I exclude "1" and only show the rest?
- Mark as New
- Bookmark
- Subscribe
- Mute
- Subscribe to RSS Feed
- Permalink
- Report Inappropriate Content
Use this expression:
If(Count(Customer) > 1, Count(Customer))
- Mark as New
- Bookmark
- Subscribe
- Mute
- Subscribe to RSS Feed
- Permalink
- Report Inappropriate Content
Hi Sunny,
I used this expression If(Count(Customer) > 1, Count(Customer)) instead of the earlier Count (Customer), but I wasn't able to exclude the bar chart with 1 count.
Can you please assist?
- Mark as New
- Bookmark
- Subscribe
- Mute
- Subscribe to RSS Feed
- Permalink
- Report Inappropriate Content
Hi,
PFA
Rgds,
Dinu1
- « Previous Replies
-
- 1
- 2
- Next Replies »