Unlock a world of possibilities! Login now and discover the exclusive benefits awaiting you.
- Qlik Community
- :
- All Forums
- :
- QlikView App Dev
- :
- Count problem with 2 dates
- Subscribe to RSS Feed
- Mark Topic as New
- Mark Topic as Read
- Float this Topic for Current User
- Bookmark
- Subscribe
- Mute
- Printer Friendly Page
- Mark as New
- Bookmark
- Subscribe
- Mute
- Subscribe to RSS Feed
- Permalink
- Report Inappropriate Content
Count problem with 2 dates
Hello,
I have a question where not sure how to get the result and need your help !
I want count the items by the input_date and output_date in one bar graph. So that i can see the difference per day between input and output. But it does not work.What am i doing wrong?
| item | input_date | output_date |
| 1012 | 01.05.2013 | 04.05.2013 |
| 2221 | 04.05.2013 | 07.05.2013 |
| 2211 | 20.05.2012 | 01.06.2013 |
| 1212 | 01.05.2013 | 06.05.2013 |
| 4532 | 03.05.2013 | 05.03.2013 |
| 4332 | 01.05.2013 | 04.05.2013 |
| 7876 | 04.05.2013 | 06.05.2013 |
Thanks a lot!
Kai
Accepted Solutions
- Mark as New
- Bookmark
- Subscribe
- Mute
- Subscribe to RSS Feed
- Permalink
- Report Inappropriate Content
Kai, create a canonical date from your two date fields
Then use this new field as dimension and your DateType field as second dimension.
Expression
=Count(DISTINCT DateType)
- Mark as New
- Bookmark
- Subscribe
- Mute
- Subscribe to RSS Feed
- Permalink
- Report Inappropriate Content
Not quite sure how your analysis works. Do you want to show a kind of histogram, with the difference between dates on x-axis?
Dimension
=Aggr( output_date - input_date, item)
Expression
=Count(Distinct item)
[take care that your dates have a numeric representation, e.g. by setting the default date format in the script to the fields date format]
Or do you want to see a bar per item, with the difference as height of the bar?
Dimension
=item
Expression
=( output_date - input_date)
Or just post your current QVW and your description of what you expect to see.
- Mark as New
- Bookmark
- Subscribe
- Mute
- Subscribe to RSS Feed
- Permalink
- Report Inappropriate Content
Not clear on the requirement are you looking for this...(Please see the attachment)
- Mark as New
- Bookmark
- Subscribe
- Mute
- Subscribe to RSS Feed
- Permalink
- Report Inappropriate Content
Hi Kai,
The solution really depends on what you need. If input and output dates are separate dates - the solution is simple (see below), if they define periods - the solution is a little bit tricky.
In case we deal with separate dates:
1. You need to build a calendar in your app with all the dates of the period (from min to max between input and output dates). At the same time the calendat should have one field, say DateId, which should be used for linking
2. Than you should link your data to the calendar so you'll be able to count the number of items per each date
In case we deal with periods it's necessary to like the data via IntervalMatch load.
Best regards,
Maxim
- Mark as New
- Bookmark
- Subscribe
- Mute
- Subscribe to RSS Feed
- Permalink
- Report Inappropriate Content
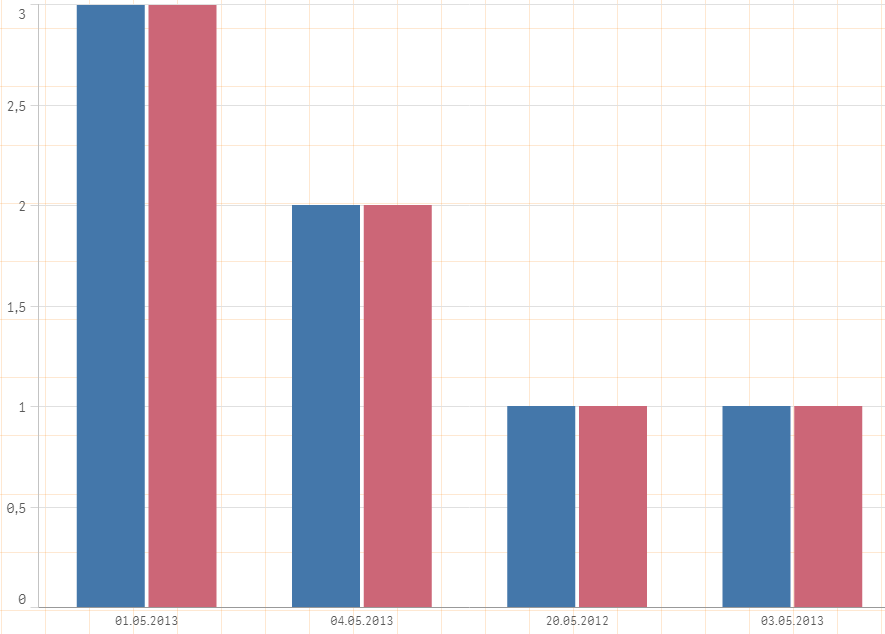
Hello,
i would like count the items per date - e.g. 04.05.2013; 2 items on input_date and 2 items on output_date.
Like this, just right ;-(
Maxim writes, it is determined on calendar.I suspect that even.
@Maxim: Can you further explain your example to me. I'm new on QlikView.
Thanks a lot!
Kai
- Mark as New
- Bookmark
- Subscribe
- Mute
- Subscribe to RSS Feed
- Permalink
- Report Inappropriate Content
Kai, create a canonical date from your two date fields
Then use this new field as dimension and your DateType field as second dimension.
Expression
=Count(DISTINCT DateType)
- Mark as New
- Bookmark
- Subscribe
- Mute
- Subscribe to RSS Feed
- Permalink
- Report Inappropriate Content
Many thanks!