Unlock a world of possibilities! Login now and discover the exclusive benefits awaiting you.
- Qlik Community
- :
- All Forums
- :
- QlikView App Dev
- :
- Counting customers that have ordered in x categori...
- Subscribe to RSS Feed
- Mark Topic as New
- Mark Topic as Read
- Float this Topic for Current User
- Bookmark
- Subscribe
- Mute
- Printer Friendly Page
- Mark as New
- Bookmark
- Subscribe
- Mute
- Subscribe to RSS Feed
- Permalink
- Report Inappropriate Content
Counting customers that have ordered in x categories
Hi
This is probably a very simple question but i am quite new to QV so any help would be appreciated.
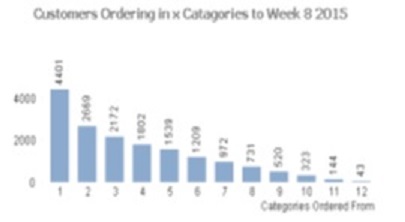
I need to create a bar chart that counts distinct customers that have ordered in 1 - 13 categories.
Would I write this in the expression or create a calculated dimention?
Any example of how this might be written woudl be really helpful.
thanks
Heather
- « Previous Replies
-
- 1
- 2
- Next Replies »
- Mark as New
- Bookmark
- Subscribe
- Mute
- Subscribe to RSS Feed
- Permalink
- Report Inappropriate Content
Im wondering if I should try and use listvalues as a calculated dimention then try to link my counts back into those buckets....just not too sure how to write it yet!
- Mark as New
- Bookmark
- Subscribe
- Mute
- Subscribe to RSS Feed
- Permalink
- Report Inappropriate Content
Valuelist rather
- Mark as New
- Bookmark
- Subscribe
- Mute
- Subscribe to RSS Feed
- Permalink
- Report Inappropriate Content
I tried ValueList at first and couldn't make it work.
In my test data I have created two new fields, CatYear* and CusYear*, so that we can aggr and count categories and customers by year.
Calculated dimension: =aggr(count(distinct CatYear), CusYear)
2nd Dimension: Year
Expression: =count(distinct Customer)
... and this seems to work, although you don't see counts of categories with zero counts. I'll play with ValueList to see if I can get something to work.
flipside
EDIT: Combinations of Category & Year and Customer & Year respectively.
- Mark as New
- Bookmark
- Subscribe
- Mute
- Subscribe to RSS Feed
- Permalink
- Report Inappropriate Content
Thanks for this, i've been working on other things for the last week.
Are you adding CatYear and CustYear to the calendar part of the script or within the Sales data?
- Mark as New
- Bookmark
- Subscribe
- Mute
- Subscribe to RSS Feed
- Permalink
- Report Inappropriate Content
Should the 2nd dimension be Category not year?
- Mark as New
- Bookmark
- Subscribe
- Mute
- Subscribe to RSS Feed
- Permalink
- Report Inappropriate Content
Hi,
maybe you could limit the category numbers to 13 like this:
=If(Aggr(Count(DISTINCT Category), Customer)<=13,Aggr(Count(DISTINCT Category), Customer))
hope this helps
regards
Marco
- Mark as New
- Bookmark
- Subscribe
- Mute
- Subscribe to RSS Feed
- Permalink
- Report Inappropriate Content
Hi
I don't need to limit the categories as there are only 13
possible options and only a max of 12 have ever been ordered by one customer.
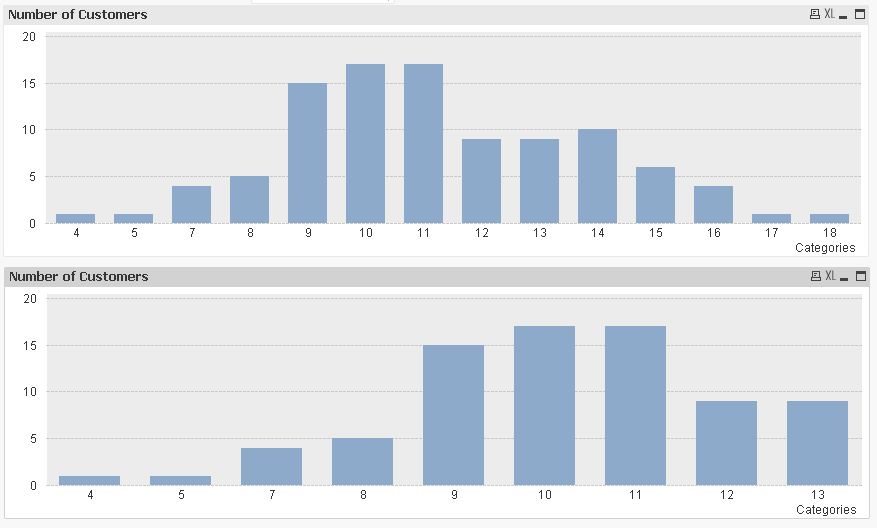
What I have managed to do is create buckets to count how many
customers have ordered from 1 category, 2 categories, 3 categories etc. using
the following;
if((Aggr(Count({<[Year]={$(vMaxYear)}>}DISTINCT Category), Customer)>0),
Aggr(Count({<[Year]={$(vMaxYear)}>}DISTINCT Category), Customer))
Which gives me a graph like this
I can replicate this to show data for the previous year, but can’t put both in the same chart.
Any ideas how I might achieve this?
Thanks
H
- « Previous Replies
-
- 1
- 2
- Next Replies »