Unlock a world of possibilities! Login now and discover the exclusive benefits awaiting you.
- Qlik Community
- :
- All Forums
- :
- QlikView App Dev
- :
- Create a pie chart with different column values
- Subscribe to RSS Feed
- Mark Topic as New
- Mark Topic as Read
- Float this Topic for Current User
- Bookmark
- Subscribe
- Mute
- Printer Friendly Page
- Mark as New
- Bookmark
- Subscribe
- Mute
- Subscribe to RSS Feed
- Permalink
- Report Inappropriate Content
Create a pie chart with different column values
I have to create a pie chart with values present in 4 different columns of a straight table. How can I do it? What should be the dimensions and expressions (Also, what are they?). I am attaching an image that gives what values are to be used in the pie chart.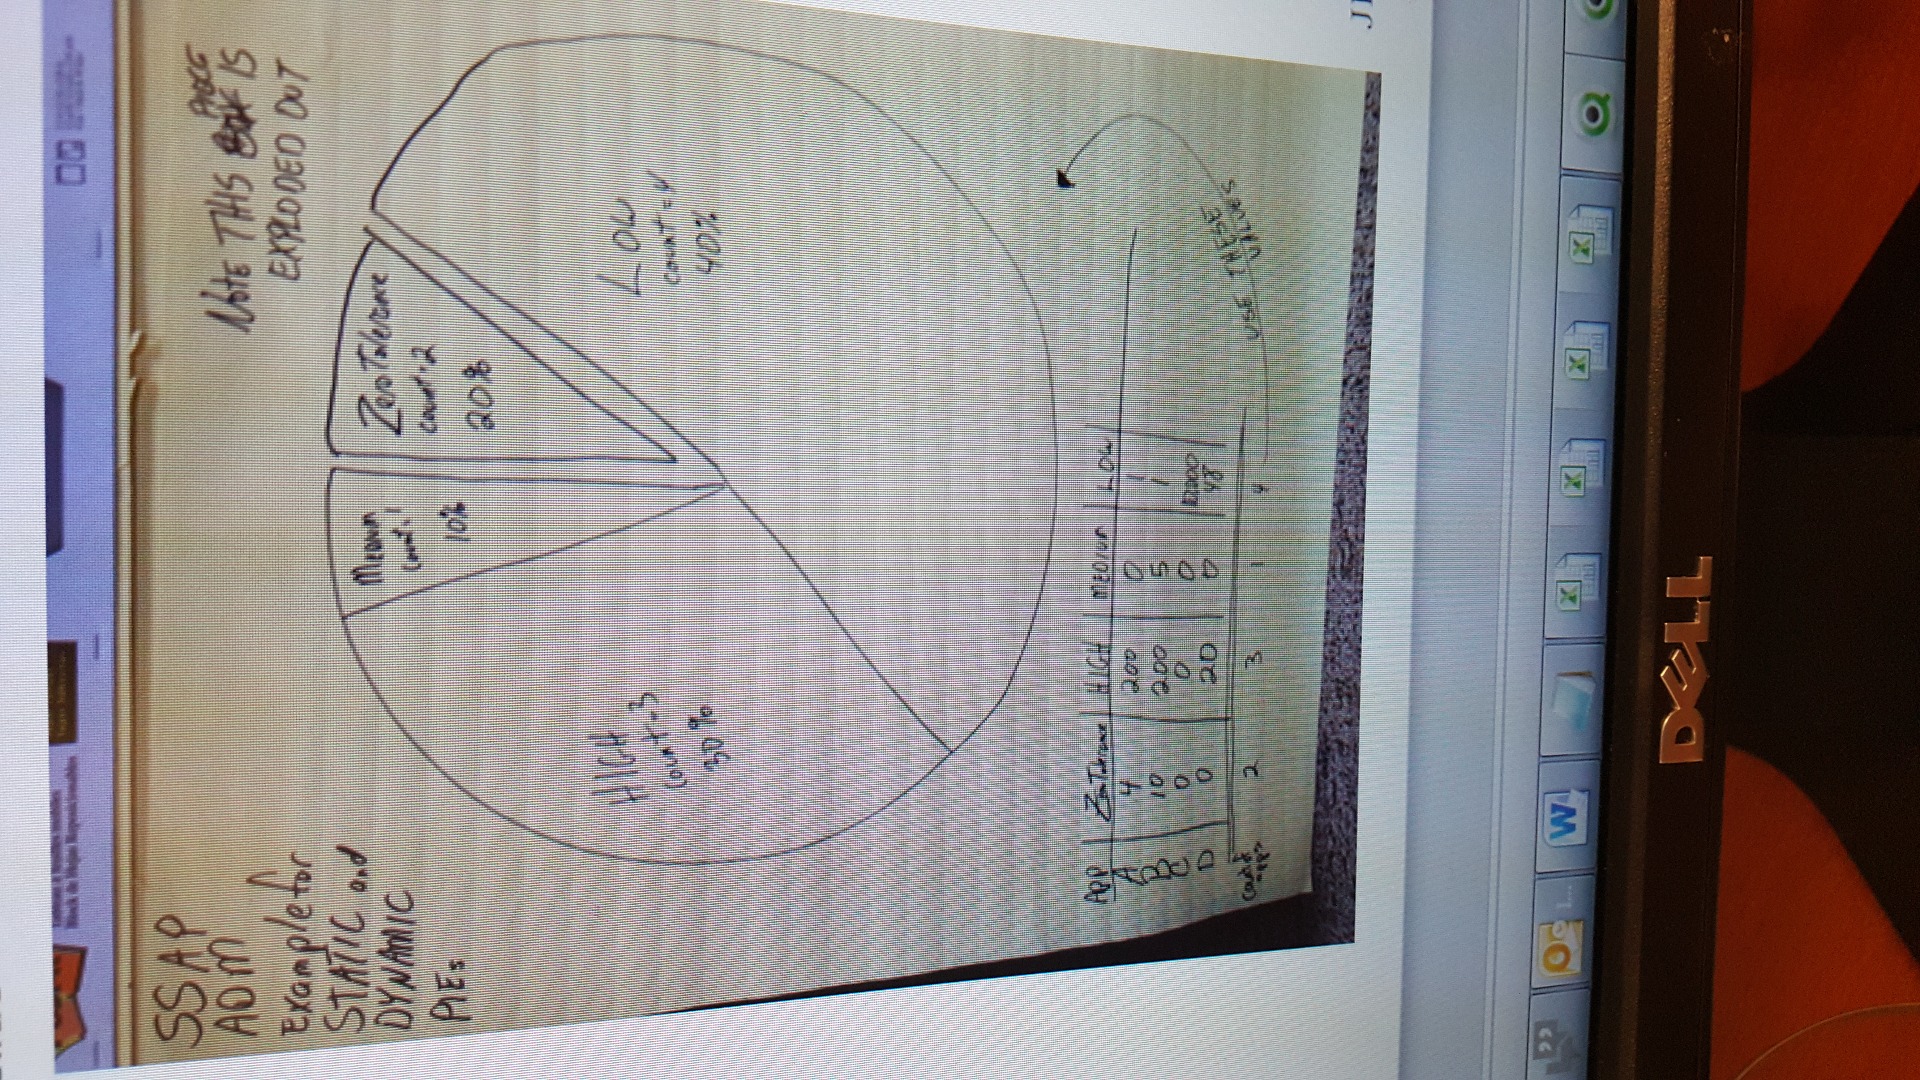
- « Previous Replies
-
- 1
- 2
- Next Replies »
- Mark as New
- Bookmark
- Subscribe
- Mute
- Subscribe to RSS Feed
- Permalink
- Report Inappropriate Content
Hi, you can create the chart without dimensions and adding each column of the table as an expression that returns the % to show, ie:
for this expressions:
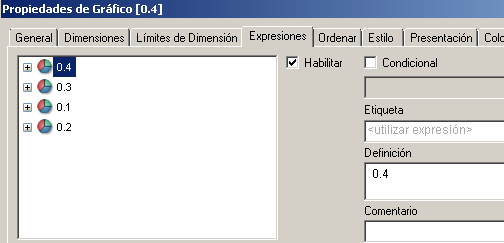
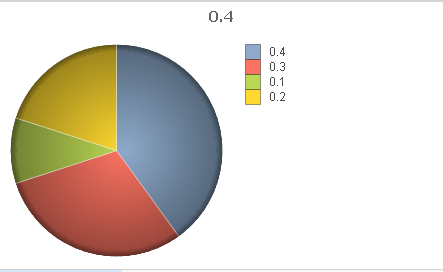
Returns this:
- Mark as New
- Bookmark
- Subscribe
- Mute
- Subscribe to RSS Feed
- Permalink
- Report Inappropriate Content
Here, you are manually defining the values. I need to add all the values present in each column and then use their totals as values for the pie chart. For example: Add all values in Column A and use the result as value in Pie Chart; similarly columns B,C and D.
- Mark as New
- Bookmark
- Subscribe
- Mute
- Subscribe to RSS Feed
- Permalink
- Report Inappropriate Content
It was an example of how you can do that, I don't know a way to use values from any chart as a source from another (maybe exporting and importing with a macro but you'll need a reload), so as a workaround you can replicate each of the table columns as expressions in the pie chart.
You'll need to adapt it using set analisys and/or Aggr() to simulate the dimensions. I will need more info about the table expressions to be more accurate.
- Mark as New
- Bookmark
- Subscribe
- Mute
- Subscribe to RSS Feed
- Permalink
- Report Inappropriate Content
You can try with Synthetic dimensions concept. Please post sample data qvw so community will help you better.
- Mark as New
- Bookmark
- Subscribe
- Mute
- Subscribe to RSS Feed
- Permalink
- Report Inappropriate Content
You can use Relative option.
- Mark as New
- Bookmark
- Subscribe
- Mute
- Subscribe to RSS Feed
- Permalink
- Report Inappropriate Content
Hi,
What contain your 4 columns? Do you have 4 expressions or the table is a cross table?
What are the expressions inside your table, and the dimensions?
Regards,
Vincent
- Mark as New
- Bookmark
- Subscribe
- Mute
- Subscribe to RSS Feed
- Permalink
- Report Inappropriate Content
I have four columns with Critical-High-Med-Low as numerical values. I need to create a pie chart with those values as percentages in the pie slices. Whenever I am adding the expressions as Critical, High, Medium and Low, the pie chart gives me all the values as 100% but not reflecting the original percentage of the values.
In simple terms, I need the total value of each column to appear in the Pie chart as percentage. I tried adding them as dimensions too, but that doesn't help either.
- Mark as New
- Bookmark
- Subscribe
- Mute
- Subscribe to RSS Feed
- Permalink
- Report Inappropriate Content
I need to know your expressions (at least two of them) to give more help building the expressions in the pie chart. Also the dimensions you're using in the table.
- Mark as New
- Bookmark
- Subscribe
- Mute
- Subscribe to RSS Feed
- Permalink
- Report Inappropriate Content
The Dimensions in the Straight table are few other fields (Both Text and Numerical Values) and the expressions contain fields that needed some calculations. The columns that I am talking about are taken as expressions.
Column Names: R, S, T, U
Dimensions are just columns from the flat file
Expressions in the Straight Table:
Sum(R)
Sum(S)
Sum(T)
Sum(U)
How to generate a pie chart with the values from the Columns R,S,T,U?
- « Previous Replies
-
- 1
- 2
- Next Replies »