Unlock a world of possibilities! Login now and discover the exclusive benefits awaiting you.
- Qlik Community
- :
- All Forums
- :
- QlikView App Dev
- :
- Create an alert based on multiple condition
- Subscribe to RSS Feed
- Mark Topic as New
- Mark Topic as Read
- Float this Topic for Current User
- Bookmark
- Subscribe
- Mute
- Printer Friendly Page
- Mark as New
- Bookmark
- Subscribe
- Mute
- Subscribe to RSS Feed
- Permalink
- Report Inappropriate Content
Create an alert based on multiple condition
Hi Experts,
Based on the attached data model I need to create an alert if it meets the following condition.
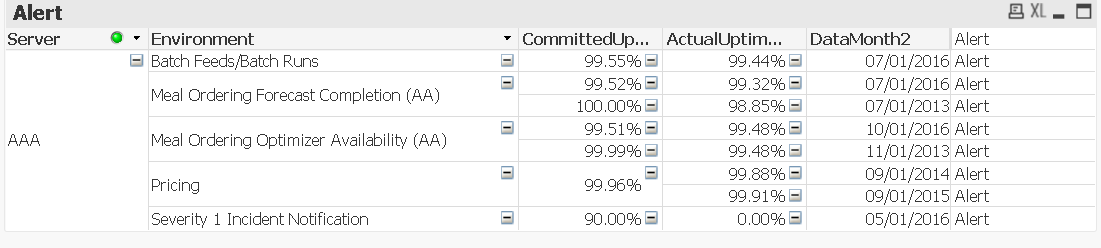
Condition 1: ActualUptimePercent < CommittedUptimePercent for a given month and
Condition 2: if ActualUptimePercent>CommittedUptimePercent for next three consecutive months.
If you see in the attached datamodel file first 4 line items meet condition 1 but don't meet condition 2 so how do I only pull the ones in green where it meets both conditions. If you see the line Item in green for Datamonth 7/1/2016 and 1/1/2016 it meets both the above conditions.
I have attached the dashboard where I can make the first condition work but I am need to incorporate both the conditions to pull only the line items highlighted in green in the data model.
Accepted Solutions
- Mark as New
- Bookmark
- Subscribe
- Mute
- Subscribe to RSS Feed
- Permalink
- Report Inappropriate Content
Try this:
Table:
LOAD
DataMonth,
Date(MonthStart(DataMonth,0),'MM/DD/YYYY') as DataMonth2,
Server,
Environment,
CommittedUptimePercent,
ActualUptimePercent,
if(ActualUptimePercent<CommittedUptimePercent,1,0) as downtime,
Server & Environment as RewardID
FROM
DB.xlsx
(ooxml, embedded labels, table is Sheet1);
FinalTable:
LOAD*,
If(Server = Previous(Previous(Previous(Server))) and Environment = Previous(Previous(Previous(Environment))) and Previous(ActualUptimePercent) > Previous(CommittedUptimePercent)
and Previous(Previous(ActualUptimePercent)) > Previous(Previous(CommittedUptimePercent))
and Previous(Previous(Previous(ActualUptimePercent))) > Previous(Previous(Previous(CommittedUptimePercent))), 1, 0) as Flag2
Resident Table
Order By Server, Environment, DataMonth desc;
DROP Table Table;
- Mark as New
- Bookmark
- Subscribe
- Mute
- Subscribe to RSS Feed
- Permalink
- Report Inappropriate Content
Anyone any thoughts on this?
- Mark as New
- Bookmark
- Subscribe
- Mute
- Subscribe to RSS Feed
- Permalink
- Report Inappropriate Content
- Mark as New
- Bookmark
- Subscribe
- Mute
- Subscribe to RSS Feed
- Permalink
- Report Inappropriate Content
Try attached
- Mark as New
- Bookmark
- Subscribe
- Mute
- Subscribe to RSS Feed
- Permalink
- Report Inappropriate Content
Sunny, thank you for your response. This works fine with the Excel Data Model that I sent but when I apply the same logic to my actual data model it's pulling a lot of line items where the given condition is not met and in some cases it's missing the ones that should be pulled. For example in the attached model it's pulling the purple ones but missing the green one which should be reported. This is happening for rest of the data in the datamodel. Any thoughts?
- Mark as New
- Bookmark
- Subscribe
- Mute
- Subscribe to RSS Feed
- Permalink
- Report Inappropriate Content
Please find attached a larger version of the data model where the suggested logic is not working 100%. If you see the Servername 'AAA' the dashboard is showing the yellow highlighted line items which are not meeting the two conditions and it's not showing the green one where both conditions are met. Likewise same thing is happening for rest of the data where it's reporting corrected somewhere but not everywhere. To meet both conditions and to be shown on the dashboard first ActualUptimePercent should be less than CommittedUptimePercent for a given month and then for next three consecutive months ActualUptimePercent should be greater than or equal to CommittedUptimePercent.
I am attaching the datamodel and the dashboard for your reference. Please let me know if you have a solution.
- Mark as New
- Bookmark
- Subscribe
- Mute
- Subscribe to RSS Feed
- Permalink
- Report Inappropriate Content
Checking
- Mark as New
- Bookmark
- Subscribe
- Mute
- Subscribe to RSS Feed
- Permalink
- Report Inappropriate Content
Try this:
Table:
LOAD
DataMonth,
Date(MonthStart(DataMonth,0),'MM/DD/YYYY') as DataMonth2,
Server,
Environment,
CommittedUptimePercent,
ActualUptimePercent,
if(ActualUptimePercent<CommittedUptimePercent,1,0) as downtime,
Server & Environment as RewardID
FROM
DB.xlsx
(ooxml, embedded labels, table is Sheet1);
FinalTable:
LOAD*,
If(Server = Previous(Previous(Previous(Server))) and Environment = Previous(Previous(Previous(Environment))) and Previous(ActualUptimePercent) > Previous(CommittedUptimePercent)
and Previous(Previous(ActualUptimePercent)) > Previous(Previous(CommittedUptimePercent))
and Previous(Previous(Previous(ActualUptimePercent))) > Previous(Previous(Previous(CommittedUptimePercent))), 1, 0) as Flag2
Resident Table
Order By Server, Environment, DataMonth desc;
DROP Table Table;
- Mark as New
- Bookmark
- Subscribe
- Mute
- Subscribe to RSS Feed
- Permalink
- Report Inappropriate Content
This worked out perfectly fine. Thank you for your help Sunny. Really appreciated.