Unlock a world of possibilities! Login now and discover the exclusive benefits awaiting you.
- Qlik Community
- :
- All Forums
- :
- QlikView App Dev
- :
- Create chart from dates range
- Subscribe to RSS Feed
- Mark Topic as New
- Mark Topic as Read
- Float this Topic for Current User
- Bookmark
- Subscribe
- Mute
- Printer Friendly Page
- Mark as New
- Bookmark
- Subscribe
- Mute
- Subscribe to RSS Feed
- Permalink
- Report Inappropriate Content
Create chart from dates range
Hello,
I have a table with 3 fields: id, startDate and endDate
| id | startDate | endDate |
|---|---|---|
| 1 | 08/01/2013 | 08/05/2013 |
| 2 | 08/04/2013 | 08/07/2013 |
y-axis: number of ids between the startDate and endDate.
x-axis: days.
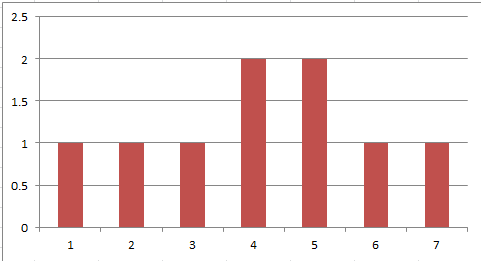
This is the chart I need. I want to count the number of ids that are between the startDate and endDate.
Any ideas on how I can do this?
Thank you,
Juan.
Accepted Solutions
- Mark as New
- Bookmark
- Subscribe
- Mute
- Subscribe to RSS Feed
- Permalink
- Report Inappropriate Content
Maybe like this:
LOAD *,
WeekDay(startDate+iterno()-1) as weekday,
Date(startDate+iterno()-1) as date
INLINE [
id, startDate, endDate
1, 08/01/2013, 08/05/2013
2, 08/04/2013, 08/07/2013
] WHILE startDate +iterno()-1 <= endDate;
Then use weekday or num(weekday) as dimension and count(id) as expression.
- Mark as New
- Bookmark
- Subscribe
- Mute
- Subscribe to RSS Feed
- Permalink
- Report Inappropriate Content
Create the interval of your dates in the script:
Set DateFormat = 'MM/DD/YYYY';
Load id,
startDate,
endDate,
endDate - startDate as interval
FROM ....;
Then create a chart with dimension inteval and count(id) as expression.
- Mark as New
- Bookmark
- Subscribe
- Mute
- Subscribe to RSS Feed
- Permalink
- Report Inappropriate Content
Hi swuehl,
The dimension is not the number of days between the endDate and startdate. It should be the days in that interval, from 1 to 7. The purpose is to know how many ids are active each day of the month.
- Mark as New
- Bookmark
- Subscribe
- Mute
- Subscribe to RSS Feed
- Permalink
- Report Inappropriate Content
Maybe like this:
LOAD *,
WeekDay(startDate+iterno()-1) as weekday,
Date(startDate+iterno()-1) as date
INLINE [
id, startDate, endDate
1, 08/01/2013, 08/05/2013
2, 08/04/2013, 08/07/2013
] WHILE startDate +iterno()-1 <= endDate;
Then use weekday or num(weekday) as dimension and count(id) as expression.