Unlock a world of possibilities! Login now and discover the exclusive benefits awaiting you.
- Qlik Community
- :
- All Forums
- :
- QlikView App Dev
- :
- Create expression for ACUMULATED values
- Subscribe to RSS Feed
- Mark Topic as New
- Mark Topic as Read
- Float this Topic for Current User
- Bookmark
- Subscribe
- Mute
- Printer Friendly Page
- Mark as New
- Bookmark
- Subscribe
- Mute
- Subscribe to RSS Feed
- Permalink
- Report Inappropriate Content
Create expression for ACUMULATED values
Hello
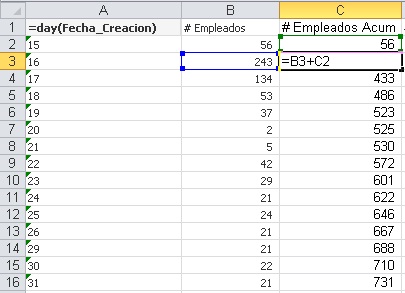
How can I create an expression to accumulate values like shown in the picture:
Thanks!!
Accepted Solutions
- Mark as New
- Bookmark
- Subscribe
- Mute
- Subscribe to RSS Feed
- Permalink
- Report Inappropriate Content
If you want to do this in the chart, there a two options:
a) use a second expression identical to your first
=count(distinct employeeID)
and activate 'full accumulation' in expression tab for that expression.
b) use as second expression
=rangesum(above(count( distinct employeeID),0, rowno() ))
Hope this helps,
Stefan
- Mark as New
- Bookmark
- Subscribe
- Mute
- Subscribe to RSS Feed
- Permalink
- Report Inappropriate Content
try:
load
day(Fecha_Creacion) as Day,
Empleados,
if(rowno()=1,Empleados,Empleados+peek([Empleados Accum])) as "Empleados Accum"
from .... etc
talk is cheap, supply exceeds demand
- Mark as New
- Bookmark
- Subscribe
- Mute
- Subscribe to RSS Feed
- Permalink
- Report Inappropriate Content
Thanks Gys
I tried this but can´t seem to get desired result...
Empleados Accum does not exist in the source I am trying to create it as new in the Pivot Chart.
#Empleados is another calculated expression as: count(distinct employeeID) where employeeID is coming from source
- Mark as New
- Bookmark
- Subscribe
- Mute
- Subscribe to RSS Feed
- Permalink
- Report Inappropriate Content
Hi.
In that case, make a table object with DAY as dimension, EMPLEADOS as a first expression, and a second expression as follows:
EMPLEADOS + BELOW(EMPLEADOS, -1, 0)
Regards.
Edit: To consider the first row, here is the complete expression:
IF(ROWNO()=1, EMPLEADOS, EMPLEADOS + BELOW(EMPLEADOS, -1, 0))
El mensaje fue editado por: Diego Caivano
- Mark as New
- Bookmark
- Subscribe
- Mute
- Subscribe to RSS Feed
- Permalink
- Report Inappropriate Content
If you want to do this in the chart, there a two options:
a) use a second expression identical to your first
=count(distinct employeeID)
and activate 'full accumulation' in expression tab for that expression.
b) use as second expression
=rangesum(above(count( distinct employeeID),0, rowno() ))
Hope this helps,
Stefan