Unlock a world of possibilities! Login now and discover the exclusive benefits awaiting you.
- Qlik Community
- :
- All Forums
- :
- QlikView App Dev
- :
- Creating Bar Chart
Options
- Subscribe to RSS Feed
- Mark Topic as New
- Mark Topic as Read
- Float this Topic for Current User
- Bookmark
- Subscribe
- Mute
- Printer Friendly Page
Turn on suggestions
Auto-suggest helps you quickly narrow down your search results by suggesting possible matches as you type.
Showing results for
Anonymous
Not applicable
2017-10-17
05:13 PM
- Mark as New
- Bookmark
- Subscribe
- Mute
- Subscribe to RSS Feed
- Permalink
- Report Inappropriate Content
Creating Bar Chart
Hi
I am trying to create a bar chart that will show :
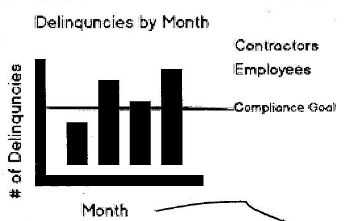
for a three month rolling period and compliance goal of 95%
I have attached a sample qvw and input files. Can someone help me generate this chart? I am very new to QlikView
Thanks,
Karly
956 Views
2 Replies
2017-10-17
08:46 PM
- Mark as New
- Bookmark
- Subscribe
- Mute
- Subscribe to RSS Feed
- Permalink
- Report Inappropriate Content
Please load the files first try yourself and then we can make as our best
Best Anil, When applicable please mark the correct/appropriate replies as "solution" (you can mark up to 3 "solutions". Please LIKE threads if the provided solution is helpful
903 Views
Anonymous
Not applicable
2017-10-18
08:57 AM
Author
- Mark as New
- Bookmark
- Subscribe
- Mute
- Subscribe to RSS Feed
- Permalink
- Report Inappropriate Content
I have loaded them myself in my real application. I just couldn't provide the file path I used to load them from.
this is the result I got when I tried:
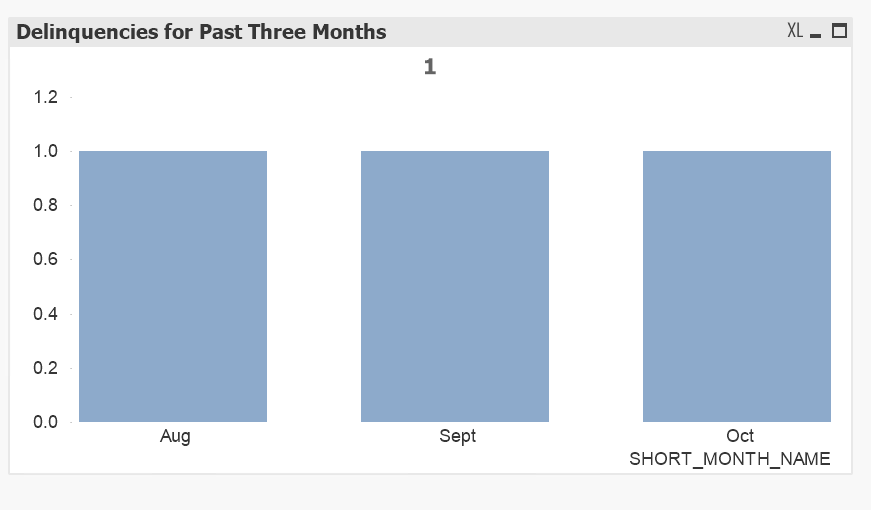
Dimensions- SHORT_MONTH_NAME
Expressions- =Is_Delinquent
903 Views