Unlock a world of possibilities! Login now and discover the exclusive benefits awaiting you.
- Qlik Community
- :
- All Forums
- :
- QlikView
- :
- Creating Demographic Breakdown Chart
- Subscribe to RSS Feed
- Mark Topic as New
- Mark Topic as Read
- Float this Topic for Current User
- Bookmark
- Subscribe
- Mute
- Printer Friendly Page
- Mark as New
- Bookmark
- Subscribe
- Mute
- Subscribe to RSS Feed
- Permalink
- Report Inappropriate Content
Creating Demographic Breakdown Chart
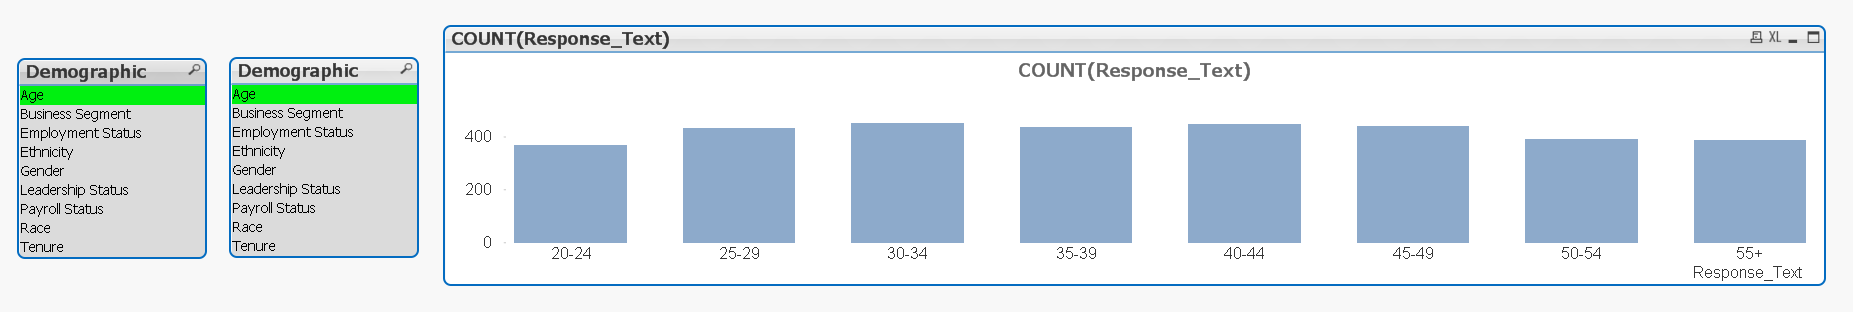
Attached is a picture which I will reference.
I want to be able to select a Demographic category in the first listbox and have it show up on the x-axis, and then be able to select a second Demographic category which will stack the bar chart based on the categories in that selection. Is there some way to do this? I assume it would involve the use of variables, but I am not well versed in that area.
Accepted Solutions
- Mark as New
- Bookmark
- Subscribe
- Mute
- Subscribe to RSS Feed
- Permalink
- Report Inappropriate Content
Storing the demographics in separate tables vs a single table would not be any significant difference in memory. And you could support many millions of respondents easily as you don't have many Response_Text values and QV only stores unique values.
However, just for neatness of the model, you may want to join the demographics into a single table after the Generic Load. I've added some code to this updated attached example showing how to do that.
-Rob
- Mark as New
- Bookmark
- Subscribe
- Mute
- Subscribe to RSS Feed
- Permalink
- Report Inappropriate Content
PCreate a bar chart
Calculated Dimension
Aggr(Class(Count(Response_Text),5),Demograpic)
Expression
Count(Response_Text)
UPDATE:
Please check enclosed file for better understanding of Class function.
- Mark as New
- Bookmark
- Subscribe
- Mute
- Subscribe to RSS Feed
- Permalink
- Report Inappropriate Content
Not really what I need...
- Mark as New
- Bookmark
- Subscribe
- Mute
- Subscribe to RSS Feed
- Permalink
- Report Inappropriate Content
Post some sample data; it shouldn't be too hard.
- Mark as New
- Bookmark
- Subscribe
- Mute
- Subscribe to RSS Feed
- Permalink
- Report Inappropriate Content
Data is stored like so: 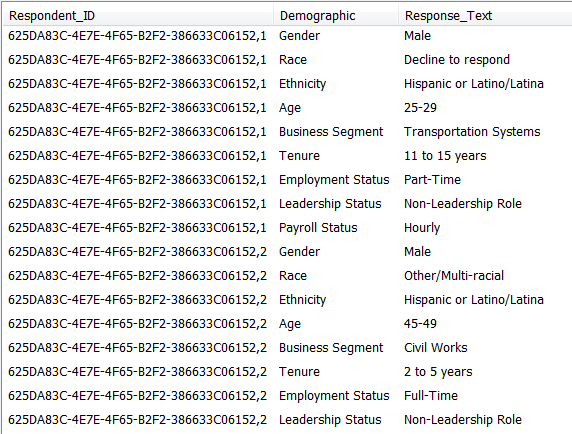
- Mark as New
- Bookmark
- Subscribe
- Mute
- Subscribe to RSS Feed
- Permalink
- Report Inappropriate Content
Take a look at this and see if it is what you had in mind. I wasn't clear on what you meant with the second list box though.
- Mark as New
- Bookmark
- Subscribe
- Mute
- Subscribe to RSS Feed
- Permalink
- Report Inappropriate Content
I modified Rebecca's example a bit. I had to load the data using GENERIC to get it to work, making the Demographic categories separate columns, It was the only way I could link the two dimensions together -- to have them link by RespondentID.
-Rob
- Mark as New
- Bookmark
- Subscribe
- Mute
- Subscribe to RSS Feed
- Permalink
- Report Inappropriate Content
Thanks! That's just the functionality I was looking for. However, would storing the data in these separate tables for each demographic potentially eat up a lot of memory if I have a few thousand respondents?
- Mark as New
- Bookmark
- Subscribe
- Mute
- Subscribe to RSS Feed
- Permalink
- Report Inappropriate Content
Storing the demographics in separate tables vs a single table would not be any significant difference in memory. And you could support many millions of respondents easily as you don't have many Response_Text values and QV only stores unique values.
However, just for neatness of the model, you may want to join the demographics into a single table after the Generic Load. I've added some code to this updated attached example showing how to do that.
-Rob
- Mark as New
- Bookmark
- Subscribe
- Mute
- Subscribe to RSS Feed
- Permalink
- Report Inappropriate Content
Thank you very much. This has been extremely helpful.