Unlock a world of possibilities! Login now and discover the exclusive benefits awaiting you.
- Qlik Community
- :
- All Forums
- :
- QlikView App Dev
- :
- Creating a Stacked & Grouped Chart?
Options
- Subscribe to RSS Feed
- Mark Topic as New
- Mark Topic as Read
- Float this Topic for Current User
- Bookmark
- Subscribe
- Mute
- Printer Friendly Page
Turn on suggestions
Auto-suggest helps you quickly narrow down your search results by suggesting possible matches as you type.
Showing results for
Not applicable
2015-05-18
02:54 PM
- Mark as New
- Bookmark
- Subscribe
- Mute
- Subscribe to RSS Feed
- Permalink
- Report Inappropriate Content
Creating a Stacked & Grouped Chart?
Hello,
I have a chart that has two dimensions and a measure:
Dimensions: [Fiscal Year], [Fiscal Quarter]
Measure: sum([Sales])
Can I convert the below chart to look the same way but have the bars stacked by 3 different sales types?
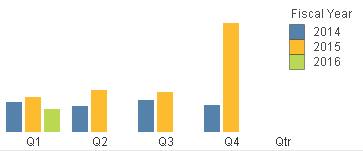
Thanks!
449 Views
0 Replies