Unlock a world of possibilities! Login now and discover the exclusive benefits awaiting you.
- Qlik Community
- :
- All Forums
- :
- QlikView App Dev
- :
- Creating a table with range
- Subscribe to RSS Feed
- Mark Topic as New
- Mark Topic as Read
- Float this Topic for Current User
- Bookmark
- Subscribe
- Mute
- Printer Friendly Page
- Mark as New
- Bookmark
- Subscribe
- Mute
- Subscribe to RSS Feed
- Permalink
- Report Inappropriate Content
Creating a table with range
Hi ,
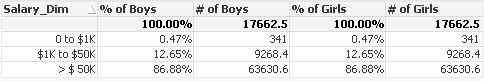
How to create a table with range as shown below.

The salary range is given as Range and no.of boys and girls salary based on slab.
Can someone help me out how to create the table.
Thanks,
Vijaya
- Mark as New
- Bookmark
- Subscribe
- Mute
- Subscribe to RSS Feed
- Permalink
- Report Inappropriate Content
Hi,
Can you share your mock data. thanks
P.S: you can try to create calculated dimension in back/front end like attached article
- Mark as New
- Bookmark
- Subscribe
- Mute
- Subscribe to RSS Feed
- Permalink
- Report Inappropriate Content
If you have field called Gender with field values like Boys and Girls. Perhaps like below?
If(Range >= 0 and Range <= 1000, Dual('0 to $1K',1),
If(Range >= 1000 and Range <= 50000, Dual('$1K to $50K',2), Dual('> $ 50K', 3))) as Range_Dim
Dimension as Range_Dim
And Formulas should be
1) % of Boys -- Avg({<Gender = {'Boys'}>} Measure)
2) # of Boys -- Count({<Gender = {'Boys'}>} FieldName)
3) % of Girls -- Avg({<Gender = {'Girls'}>} Measure)
4) # of Girls -- Count({<Gender = {'Girls'}>} FieldName)
- Mark as New
- Bookmark
- Subscribe
- Mute
- Subscribe to RSS Feed
- Permalink
- Report Inappropriate Content
Hi ,
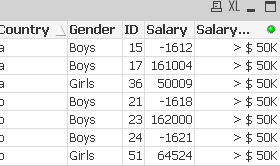
Please the sample data and qvd.
Can you please tell me how to get the negative values in the range.
- Mark as New
- Bookmark
- Subscribe
- Mute
- Subscribe to RSS Feed
- Permalink
- Report Inappropriate Content
PFA
- Mark as New
- Bookmark
- Subscribe
- Mute
- Subscribe to RSS Feed
- Permalink
- Report Inappropriate Content
Hi Anil,
Thank you for your help.
Did we use the same calculation or Salary_Dim Column??
Also I have observed the negative values are falling under the range >$50.
- Mark as New
- Bookmark
- Subscribe
- Mute
- Subscribe to RSS Feed
- Permalink
- Report Inappropriate Content
Yes, we can use. May be the reason we are calculating 0-1000, 1000-50k and >50k. That means, We are not calculating Negative now. For now, You can remove >0 and use directly like
If(Salary<1000, '<$1k')