Unlock a world of possibilities! Login now and discover the exclusive benefits awaiting you.
- Qlik Community
- :
- All Forums
- :
- QlikView App Dev
- :
- Creating pivot or straight table
- Subscribe to RSS Feed
- Mark Topic as New
- Mark Topic as Read
- Float this Topic for Current User
- Bookmark
- Subscribe
- Mute
- Printer Friendly Page
- Mark as New
- Bookmark
- Subscribe
- Mute
- Subscribe to RSS Feed
- Permalink
- Report Inappropriate Content
Creating pivot or straight table
Hi,
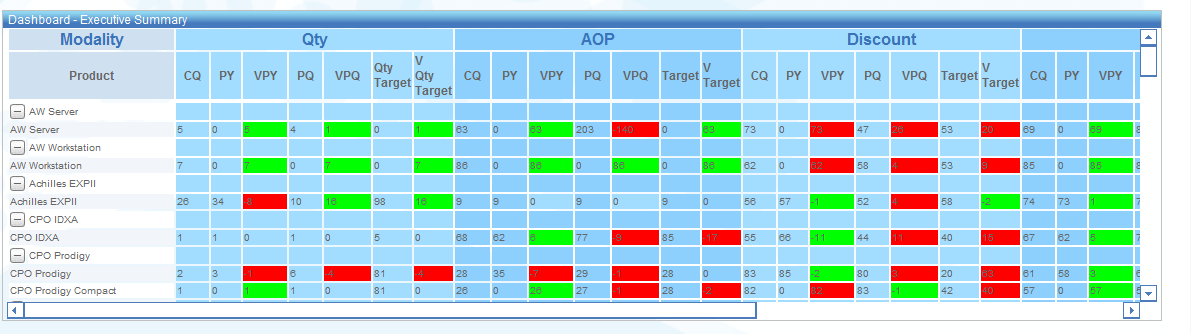
I want to know if it is possible to create a chart as below. If it is anyone possible please tell me the procedure to create it.
- Tags:
- new_to_qlikview
- Mark as New
- Bookmark
- Subscribe
- Mute
- Subscribe to RSS Feed
- Permalink
- Report Inappropriate Content
Hi, it is posible you have to create a pivot table using this dimension and expresion
of course you have to use this relation of attributes, if you have it in the model you can do it
if you have the MODALITY and PRODUCT dimensions and the relation between them, you will can
Fernando
- Mark as New
- Bookmark
- Subscribe
- Mute
- Subscribe to RSS Feed
- Permalink
- Report Inappropriate Content
Yes its possible to create above chart using pivot table.
Please check this link: http://community.qlik.com/thread/107469
Modality and product are two dimensions and values can be displayed
based on expression in expression tab
Please attach sample file.
- Mark as New
- Bookmark
- Subscribe
- Mute
- Subscribe to RSS Feed
- Permalink
- Report Inappropriate Content
Go for Pivot
- Mark as New
- Bookmark
- Subscribe
- Mute
- Subscribe to RSS Feed
- Permalink
- Report Inappropriate Content
Thanks everyone for your replies.
Actually Modality is not dimension only product is the dimension.
Modality,Qty,AOP and discount are just the headings.
CQ(Current Quarter),PY(Prior Year) etc are sub headings.
I have to calculate Qty, AOP and Discount for CQ,PY,PQ,VPY etc.
I want to know is it possible to calculate and display the values as above figure.
- Mark as New
- Bookmark
- Subscribe
- Mute
- Subscribe to RSS Feed
- Permalink
- Report Inappropriate Content
Hi,
Use Pivot table option for this and if necessary make some changes in load script or the data model for this.
Thanks & Best Regards,
Anand