Unlock a world of possibilities! Login now and discover the exclusive benefits awaiting you.
- Qlik Community
- :
- All Forums
- :
- QlikView App Dev
- :
- Creating relation between expression and new colum...
- Subscribe to RSS Feed
- Mark Topic as New
- Mark Topic as Read
- Float this Topic for Current User
- Bookmark
- Subscribe
- Mute
- Printer Friendly Page
- Mark as New
- Bookmark
- Subscribe
- Mute
- Subscribe to RSS Feed
- Permalink
- Report Inappropriate Content
Creating relation between expression and new column
Hi all,
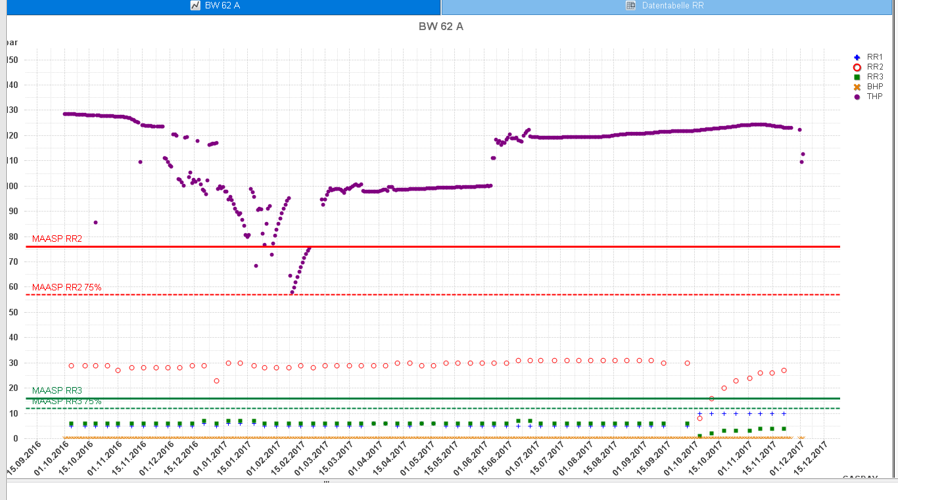
I have very complicated requirement.I have to link expression in bar chart RR1 ,RR2,RR3 with newly excel data column MAASP[bar].
Please find the snapshot and data and please help me .
Regards
Manu
- Mark as New
- Bookmark
- Subscribe
- Mute
- Subscribe to RSS Feed
- Permalink
- Report Inappropriate Content
Can you share expected output, difficult to understand what do you need exactly.
- Mark as New
- Bookmark
- Subscribe
- Mute
- Subscribe to RSS Feed
- Permalink
- Report Inappropriate Content
Hi Digvijay ,
RR1 RR2 RR3 are expressions in chart while in excel sheet they have corresponding MAASP bar values in excel sheet .In bar chart we want to show MASSP BAR values to corresponding RR1 RR2 RR3 values.
Regards
Manu
- Mark as New
- Bookmark
- Subscribe
- Mute
- Subscribe to RSS Feed
- Permalink
- Report Inappropriate Content
Not sure but, something like this in RR1,RR2..expressions -
1. RR1 - Sum({<Ringraum = {'RR1'}>}MAASP)
similarly for RR2, and RR3
Not sure if Other category Bohrung has any significance here or not.
- Mark as New
- Bookmark
- Subscribe
- Mute
- Subscribe to RSS Feed
- Permalink
- Report Inappropriate Content
Hi Digvijay,
Bohrung has very huge significance as every bohrung has correspondingRR1/RR2/RR3 and every RR1/RR2/RR3 for Bohrung has Maasp values.
Regards
MANU
- Mark as New
- Bookmark
- Subscribe
- Mute
- Subscribe to RSS Feed
- Permalink
- Report Inappropriate Content
Yes, so Bohrung is your bar chart dimension?
- Mark as New
- Bookmark
- Subscribe
- Mute
- Subscribe to RSS Feed
- Permalink
- Report Inappropriate Content
No Bohrung will be used as key filter.
- Mark as New
- Bookmark
- Subscribe
- Mute
- Subscribe to RSS Feed
- Permalink
- Report Inappropriate Content
- Mark as New
- Bookmark
- Subscribe
- Mute
- Subscribe to RSS Feed
- Permalink
- Report Inappropriate Content
You have created this chart (image above) using the three fields that you provided in the sample? 1) I am not sure if I be able to replicate the chart and if I did how much time would I be spending to replicate it  ... 2) I am not really sure what is that you are looking to fix... can you make my life easier by creating a dashboard with the data loaded and the chart created in a sample qvw and then letting us know what is the problem that you are trying to fix
- Mark as New
- Bookmark
- Subscribe
- Mute
- Subscribe to RSS Feed
- Permalink
- Report Inappropriate Content
Hi all thanks for help, by just doing minor change in data source i got my answer.
Thanks for your help
Regards
Manu