Unlock a world of possibilities! Login now and discover the exclusive benefits awaiting you.
- Qlik Community
- :
- All Forums
- :
- QlikView App Dev
- :
- Cross table question
- Subscribe to RSS Feed
- Mark Topic as New
- Mark Topic as Read
- Float this Topic for Current User
- Bookmark
- Subscribe
- Mute
- Printer Friendly Page
- Mark as New
- Bookmark
- Subscribe
- Mute
- Subscribe to RSS Feed
- Permalink
- Report Inappropriate Content
Cross table question
Hello,
I am really new to Qlikview and I have a question which will seem to most of you really simple.
I would like to import data from Excel using the Wizard. My problem is that my table is a cross table, with columns for the different months of the year, with several fields to be imported in different lines (see test file attached). I use the Crosstable function, this works fine. However I do not know how to import so that all values in lines 2 to 4 are imported in different fields and not as a value of the same F2 field (I am not sure this is clear...). I would like the values to be usable for calculations.
Here is the script I used :
Directory;
CrossTable([Year-Month], Data)
LOAD F1,
[2017-01],
[2017-02],
[2017-03],
[2017-04],
[2017-05],
[2017-06],
[2017-07],
[2017-08],
[2017-09],
[2017-10],
[2017-11],
[2017-12]
FROM
[..\Desktop\QV_test.xlsx]
(ooxml, embedded labels, table is Feuil1);
I guess the solution is quite simple but after some hours of research I did not find it.
Any help will be appreciated.
- « Previous Replies
-
- 1
- 2
- Next Replies »
- Mark as New
- Bookmark
- Subscribe
- Mute
- Subscribe to RSS Feed
- Permalink
- Report Inappropriate Content
Thanks again for your help.
In theory it works however this is not exactly what I wanted initially. I would prefer to have the indicator names in fields rather than in measures. I think it is much easier to manage.
My main concern is that I would like to do some calculations, ratios using the indicator names, for example KPI_01_04 / KPI_01_02, and see this in a chart over a period of time or in a table. I do not know how to do this easily ?
- Mark as New
- Bookmark
- Subscribe
- Mute
- Subscribe to RSS Feed
- Permalink
- Report Inappropriate Content
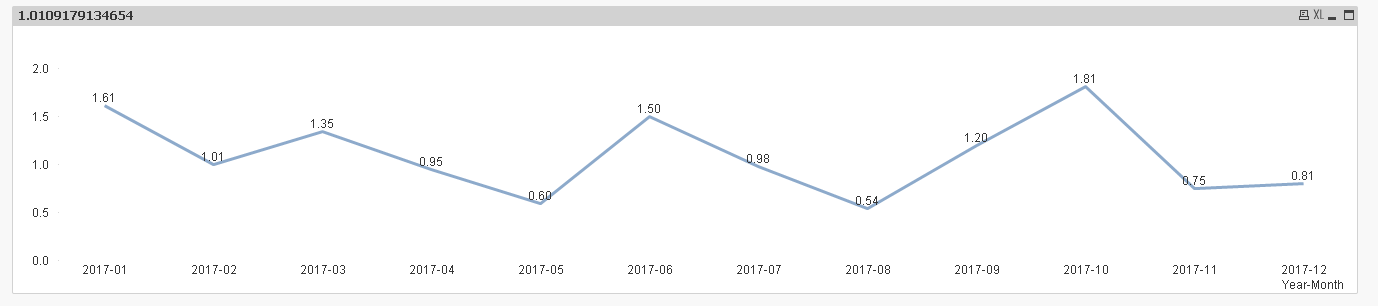
Trust me, nothing is going to be easier to maintain then the data structure we see above... now getting back to your example where you want to do KPI_01_04 / KPI_01_02 over time... I would use set analysis like this
=Sum({<F2 = {'KPI_01_04'}>}Data)/Sum({<F2 = {'KPI_01_02'}>}Data)
- Mark as New
- Bookmark
- Subscribe
- Mute
- Subscribe to RSS Feed
- Permalink
- Report Inappropriate Content
OK, I did not know about set analysis. It looks super powerful, as I said before I am an absolute beginner with QV.
Could you send me the QV file, I cannot reproduce the same chart that you did?
- Mark as New
- Bookmark
- Subscribe
- Mute
- Subscribe to RSS Feed
- Permalink
- Report Inappropriate Content
Actually I downloaded your file but I cannot open it since I am using Personal Edition.
Could you send me a snapshot of the chart properties so that I can see how it works.
Thank you so much.
- Mark as New
- Bookmark
- Subscribe
- Mute
- Subscribe to RSS Feed
- Permalink
- Report Inappropriate Content
Sure thing
Dimension tab
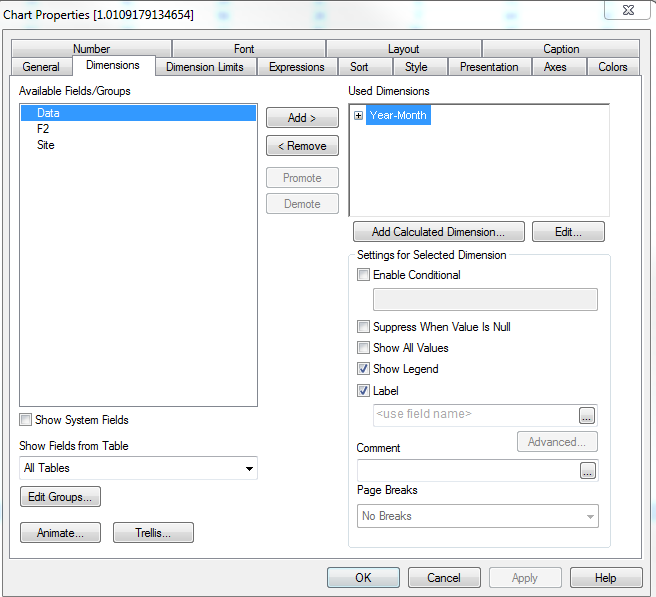
Expression tab

Did not make any other changes I think
- « Previous Replies
-
- 1
- 2
- Next Replies »