Unlock a world of possibilities! Login now and discover the exclusive benefits awaiting you.
- Qlik Community
- :
- All Forums
- :
- QlikView App Dev
- :
- Cumulative calculation
- Subscribe to RSS Feed
- Mark Topic as New
- Mark Topic as Read
- Float this Topic for Current User
- Bookmark
- Subscribe
- Mute
- Printer Friendly Page
- Mark as New
- Bookmark
- Subscribe
- Mute
- Subscribe to RSS Feed
- Permalink
- Report Inappropriate Content
Cumulative calculation
Hi All,
i have employee numbers which are around 5000,
But if i calculate distinct ...they are only 289,
Now i have these employees allocated/tagged to certain post say ABC having startdate and enddate,
number of employess gets added month by month and want a chart to show its head count that in this month this was the head count,in this quarter this was the head count or in this year this was the head count.
When i used count(Distinct (Employee Number)) it shows me number of employee number allocated in that month
But What i want is till that month how many employee number wr present
- Mark as New
- Bookmark
- Subscribe
- Mute
- Subscribe to RSS Feed
- Permalink
- Report Inappropriate Content
any one needs more explaination?...if yes which part/
?
- Mark as New
- Bookmark
- Subscribe
- Mute
- Subscribe to RSS Feed
- Permalink
- Report Inappropriate Content
Please upload sample application.
- Mark as New
- Bookmark
- Subscribe
- Mute
- Subscribe to RSS Feed
- Permalink
- Report Inappropriate Content
Hi Saumya,
Use a logical island to achieve your goal.
Do resident load from your fact table and load only YearMonth field of it.
So u will be having a island table say it as "IslandMonth" with only field called YrMth.
Now in your chart use YrMth as dimension and in expression use Count(Distinct If(DateYrMth <= YrMth,EmployeeNo))
Here DateYrMth should be in your fact table and YrMnth will be in ur island table.
Thanks
- Mark as New
- Bookmark
- Subscribe
- Mute
- Subscribe to RSS Feed
- Permalink
- Report Inappropriate Content
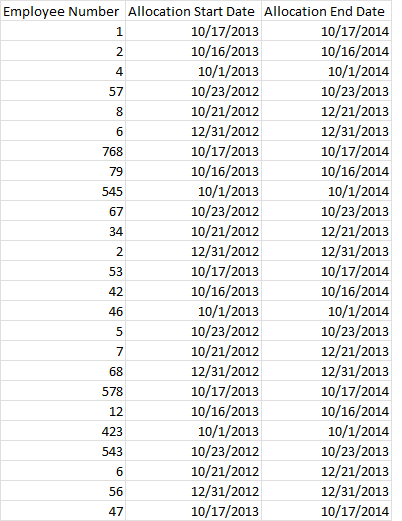
Please consider this as data
I have calculated Month,Quarter and Year based on allocation start date
Hope now it would be clear
- Mark as New
- Bookmark
- Subscribe
- Mute
- Subscribe to RSS Feed
- Permalink
- Report Inappropriate Content
Hey Gowri there is no problem with the data model.
just need the way out to calculate cumulative sum for employee numbers
- Mark as New
- Bookmark
- Subscribe
- Mute
- Subscribe to RSS Feed
- Permalink
- Report Inappropriate Content
Hi Saumya,
Atleast add data in txt or in table format.. you have added an image.
- Mark as New
- Bookmark
- Subscribe
- Mute
- Subscribe to RSS Feed
- Permalink
- Report Inappropriate Content
hey sushil
sorry for that,
but just wwanted to give an idea...you can just take 3- 4 rows and try it