Unlock a world of possibilities! Login now and discover the exclusive benefits awaiting you.
- Qlik Community
- :
- All Forums
- :
- QlikView App Dev
- :
- Re: Customer Retention Challenge
- Subscribe to RSS Feed
- Mark Topic as New
- Mark Topic as Read
- Float this Topic for Current User
- Bookmark
- Subscribe
- Mute
- Printer Friendly Page
- Mark as New
- Bookmark
- Subscribe
- Mute
- Subscribe to RSS Feed
- Permalink
- Report Inappropriate Content
Customer Retention Challenge
Hi all,
I’ve been stumped trying to solve a complex set analysis expression. The basic description is that I am trying to compare a customer list during two different dates. I refer to them as Date and Lookback Date.
Attached is my attempt and below is an example
Eg
Date | Customer |
Jan 2014 | A |
Feb 2014 | A |
Feb 2014 | B |
Jan 2015 | A |
Jan 2015 | B |
Feb 2015 | B |
Feb 2015 | C |
I’d like to start by creating a chart like this.
Date | # | Lookback Date | # LB | Added | Removed | Retained |
Jan 2015 | 2 | Jan 2014 | 1 | 1 | 0 | 1 |
Feb 2015 | 2 | Feb 2014 | 2 | 1 | 1 | 1 |
- Mark as New
- Bookmark
- Subscribe
- Mute
- Subscribe to RSS Feed
- Permalink
- Report Inappropriate Content
Hi,
Do you want the text boxes value in the chart? Like this
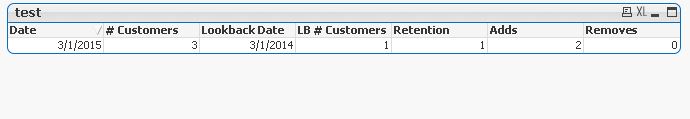
if yes, PFA.
if not, could you please give bit detail and expected output..
- Mark as New
- Bookmark
- Subscribe
- Mute
- Subscribe to RSS Feed
- Permalink
- Report Inappropriate Content
Have you had a look at the "Telecom Churn" demo application that is available at the demo site of Qlik? You can download the full QVW and study how CHURN (customer active/ceased retention) is solved in that.
- Mark as New
- Bookmark
- Subscribe
- Mute
- Subscribe to RSS Feed
- Permalink
- Report Inappropriate Content
This is absolutely on the right track.
The only missing component is that you only incorporate one lookback period (Mar-2014 compared to Mar-2015). I want to run all of those calculations against multiple lookback periods (like Jan-2014 through Dec-2014 compared to Jan-2015 through Dec-2015).
- Mark as New
- Bookmark
- Subscribe
- Mute
- Subscribe to RSS Feed
- Permalink
- Report Inappropriate Content
Excellent example, thank you!
I was asked to build a chart in this specific format but I think we should absolutely incorporate views seen in the Churn example.
Cheers!
-Eric
- Mark as New
- Bookmark
- Subscribe
- Mute
- Subscribe to RSS Feed
- Permalink
- Report Inappropriate Content
I got a hint to use discrete values in my set expressions by way of variables. Here is some progress in the right direction but the resulting values still appear to be incorrect in my Combo Chart and Flat Table compared to by text boxes.
Anyone else see what I'm missing?