Unlock a world of possibilities! Login now and discover the exclusive benefits awaiting you.
- Qlik Community
- :
- All Forums
- :
- QlikView App Dev
- :
- Customized data points in the graph
- Subscribe to RSS Feed
- Mark Topic as New
- Mark Topic as Read
- Float this Topic for Current User
- Bookmark
- Subscribe
- Mute
- Printer Friendly Page
- Mark as New
- Bookmark
- Subscribe
- Mute
- Subscribe to RSS Feed
- Permalink
- Report Inappropriate Content
Customized data points in the graph
Hi,
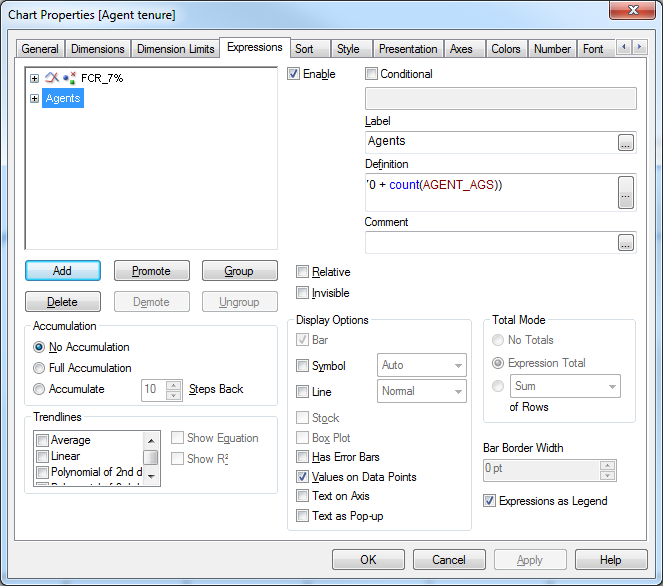
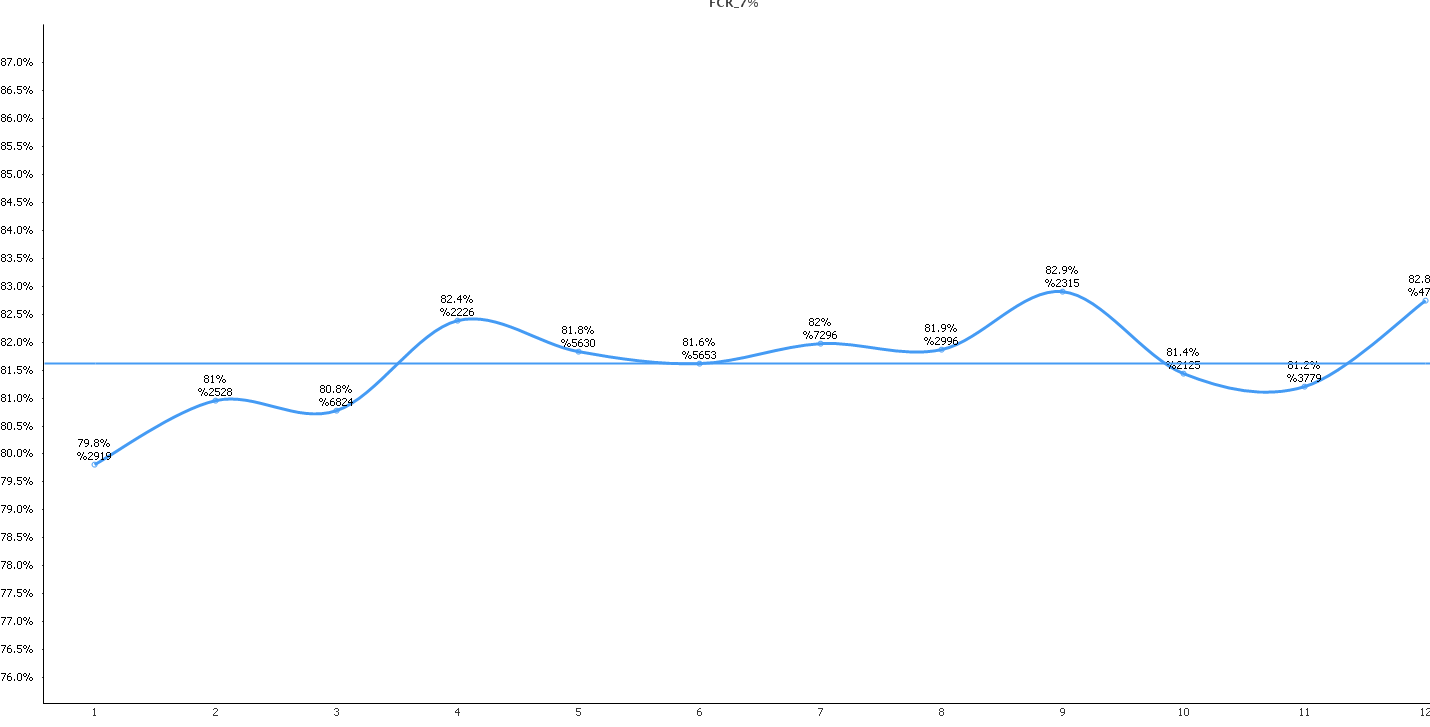
In my Qlikview line graph I've enabled data points over a period of 12 months that depicts a percentage. This is also the expression used in the graph. FCR% = sum(a)/sum(b), represented as a %. Now I'm trying to represent the number of records in the monthly data points i.e count (field x) in addition to the percentage shown. I've tried this by addition another expression however this had distorted the view. Please help.
Graph
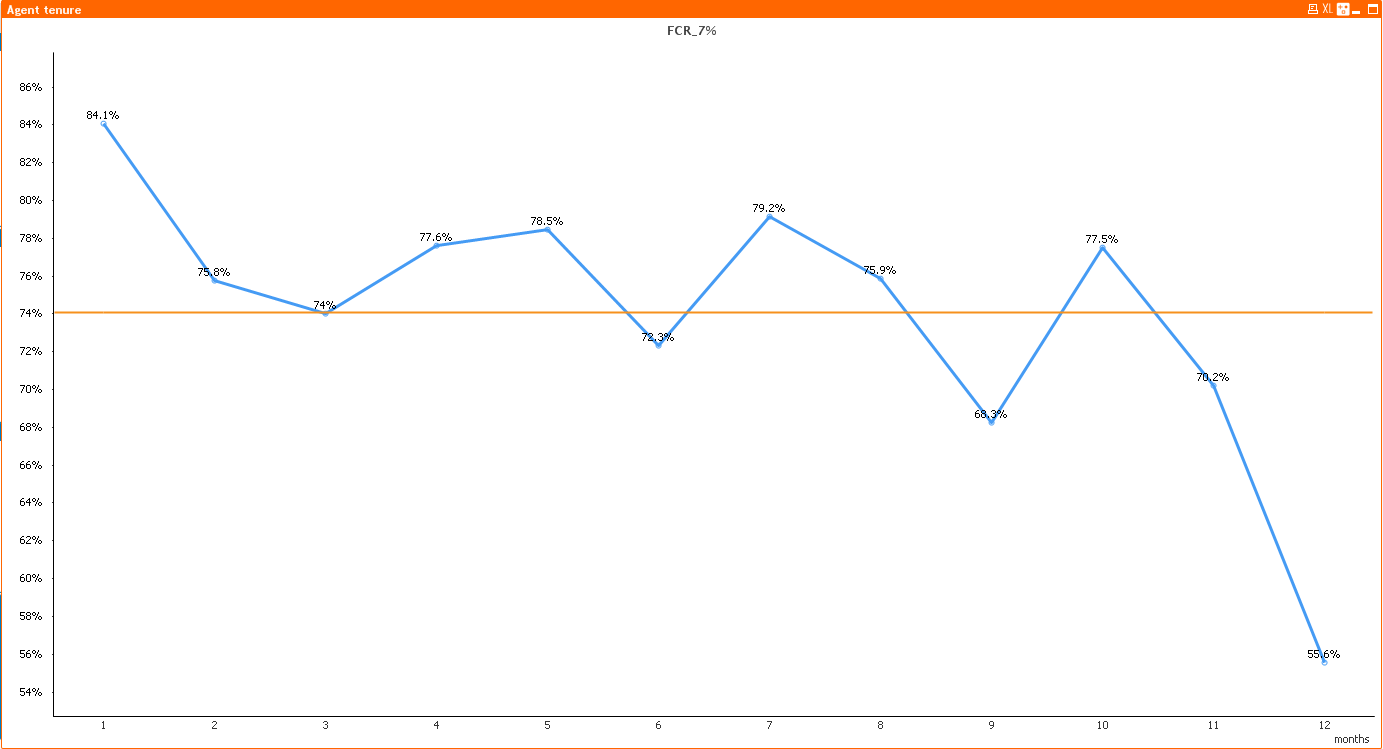
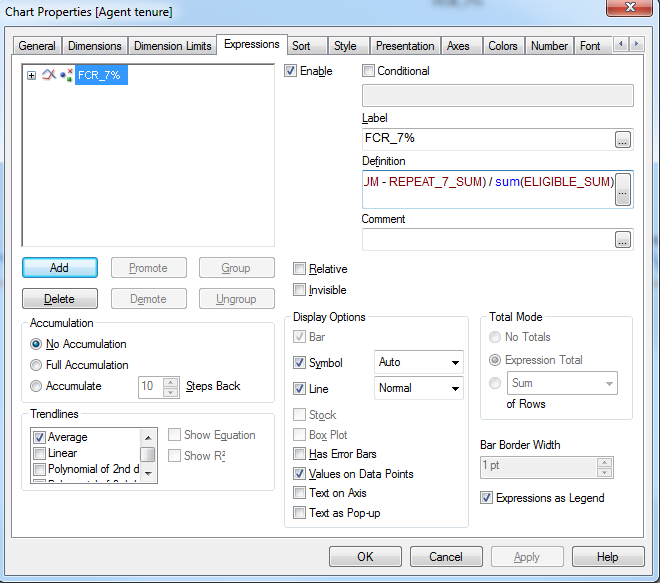
FCR_7% expression and shown as Values on Data Points, checked.
- Tags:
- new_to_qlikview
- « Previous Replies
-
- 1
- 2
- Next Replies »
- Mark as New
- Bookmark
- Subscribe
- Mute
- Subscribe to RSS Feed
- Permalink
- Report Inappropriate Content
Hi Hari,
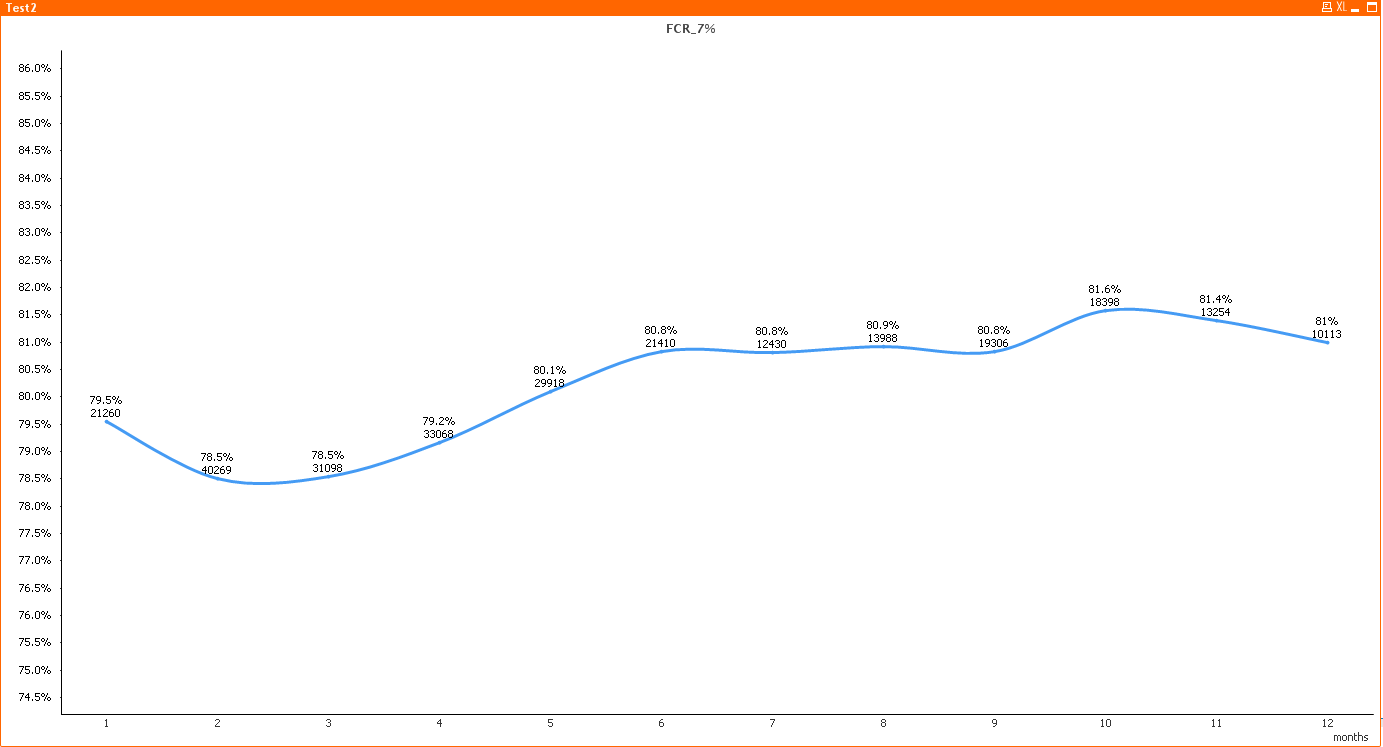
I was working on the same thought process of attempting to map a second expression to the original percentage field. The problem I faced then, was the second expression (count) distorted the values represented in the graph. However the example you provided really helped. The trick was to un-tick line/symbol option on the secondary expression and just represent by the value on the data points. Thanks mate. Cheers.
- Mark as New
- Bookmark
- Subscribe
- Mute
- Subscribe to RSS Feed
- Permalink
- Report Inappropriate Content
Hi,
In this case you can go for represnting count as Value on Axis which is the next option.
- Mark as New
- Bookmark
- Subscribe
- Mute
- Subscribe to RSS Feed
- Permalink
- Report Inappropriate Content
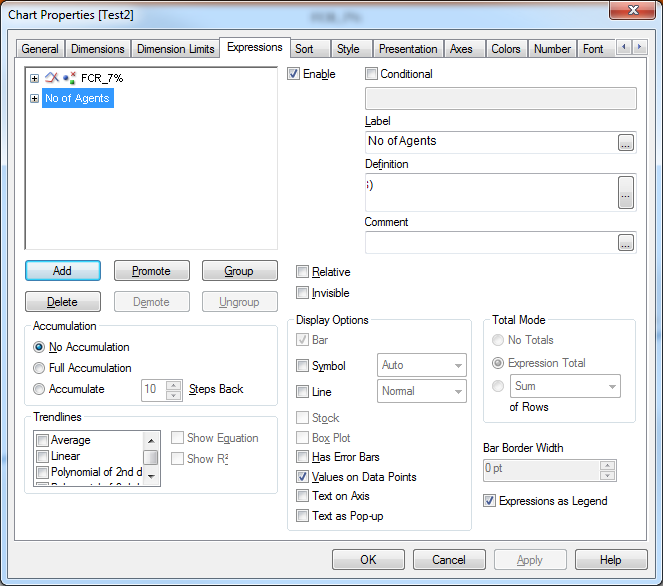
Hi,
See the below Image, It may resolve your concern.
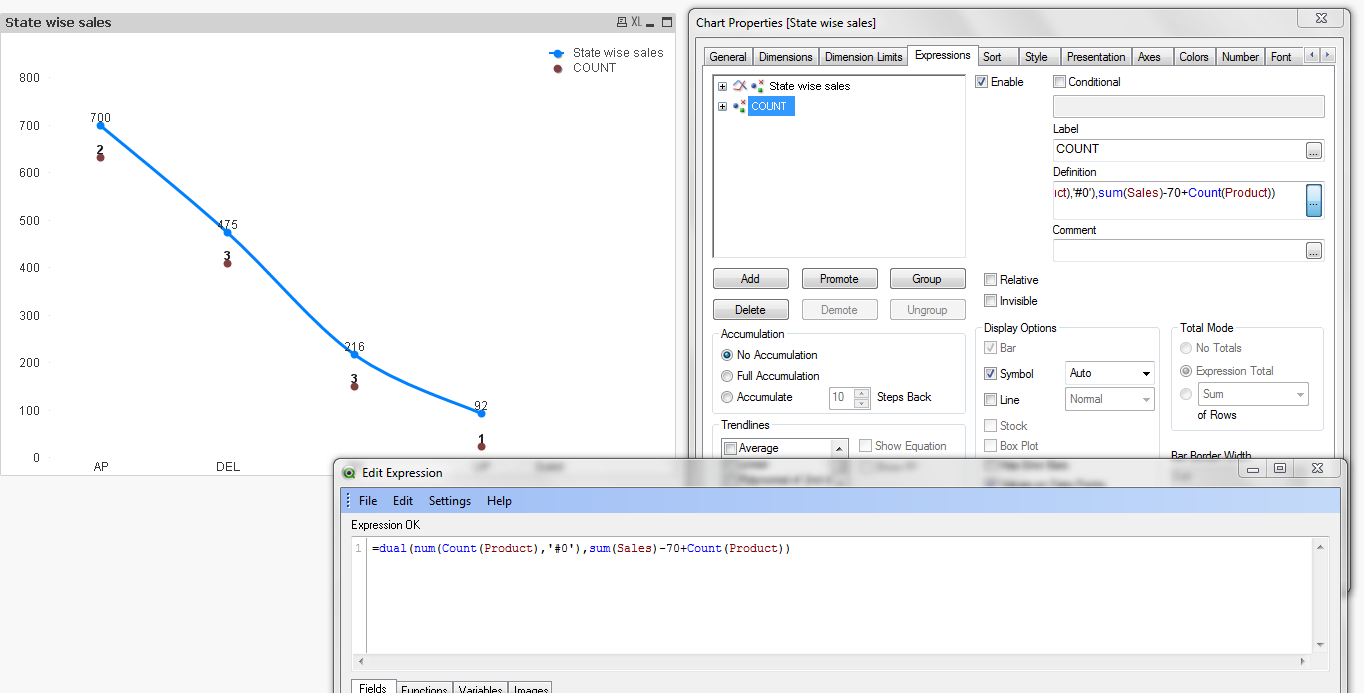
Thanks
- Mark as New
- Bookmark
- Subscribe
- Mute
- Subscribe to RSS Feed
- Permalink
- Report Inappropriate Content
For some reason the expression with "DUAL" does not seem to work. It distorted the graph again. Could this be dual function having -70 as a static value. The values on the calculation is a much large value than FCR% represented hence could be why this is distorting again. Sample data set were copied earlier. I used,
=dual(num(count(AGENT_AGS),'%0'),sum(ELIGIBLE_SUM-REPEAT_7_SUM) - 70 + count(AGENT_AGS))
For data point 1 (months = 1), sum(ELIGIBLE_SUM-REPEAT_7_SUM) is 2919 but the FCR% is only 79.8%.
- Mark as New
- Bookmark
- Subscribe
- Mute
- Subscribe to RSS Feed
- Permalink
- Report Inappropriate Content
Hi,
Here 70 is the static value that is used to place Data points below the line. i.e if sum is 200 then the datapoint is placed at 200-70 ie. at 130 but the value won't change. Modify your expression according to that. It is advised to Enable simble with Auto attribute in the expression option above line.
Thanks
- « Previous Replies
-
- 1
- 2
- Next Replies »