Unlock a world of possibilities! Login now and discover the exclusive benefits awaiting you.
- Qlik Community
- :
- All Forums
- :
- QlikView App Dev
- :
- Cyclic in Bar Graph
- Subscribe to RSS Feed
- Mark Topic as New
- Mark Topic as Read
- Float this Topic for Current User
- Bookmark
- Subscribe
- Mute
- Printer Friendly Page
- Mark as New
- Bookmark
- Subscribe
- Mute
- Subscribe to RSS Feed
- Permalink
- Report Inappropriate Content
Cyclic in Bar Graph
Dear Folk,
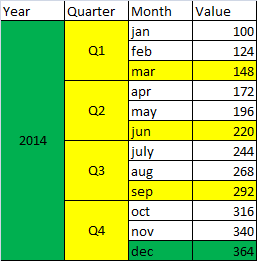
I am Facing a issue in creating a Bar Chart with Cyclic Expression, where there is no problem with showing month wise data, but when user want to see Quarter wise data in Bar graph then graph should show the data of Maximum of month(for example for Q1 it should show March Data,for Q2 it should Show Jun Data, And so on) similaly for Year wise it should show Dec Data in Cyclic Dimension.
Pleas see The following Excel for more Under Standing.
| Year | Quarter | Month | Value |
| 2014 | Q1 | jan | 100 |
| feb | 124 | ||
| mar | 148 | ||
| Q2 | apr | 172 | |
| may | 196 | ||
| jun | 220 | ||
| Q3 | july | 244 | |
| aug | 268 | ||
| sep | 292 | ||
| Q4 | oct | 316 | |
| nov | 340 | ||
| dec | 364 |
Please See anybody can Help.
Thanx
- « Previous Replies
- Next Replies »
Accepted Solutions
- Mark as New
- Bookmark
- Subscribe
- Mute
- Subscribe to RSS Feed
- Permalink
- Report Inappropriate Content
Fiscal Year is easy. Currently I am dividing by 3 because I am assuming the year end to be Dec.
Join (Temp)
LOAD *,
1 as Flag
Resident Temp
Where Mod(Month(Date), 3) = 0;
DROP Table Temp;
If your years end is Jan (for example)
Join (Temp)
LOAD *,
1 as Flag
Resident Temp
Where Mod(Month(AddMonths(Date, -1)), 3) = 0;
DROP Table Temp;
This will now flag the 1st Month, 4th Month, 7th Month and 10th Month for quarters.
Still need to work on your 1st question
Best,
S
- Mark as New
- Bookmark
- Subscribe
- Mute
- Subscribe to RSS Feed
- Permalink
- Report Inappropriate Content
You can use a if statement for expressions. Something like this:
If(GetCurrentField(Cycle_Group) = 'Month', expression1, If(GetCurrentField(Cycle_Group) = 'Quarter', expression2...and so on
HTH
Best,
S
- Mark as New
- Bookmark
- Subscribe
- Mute
- Subscribe to RSS Feed
- Permalink
- Report Inappropriate Content
Dear Sunindia,
Thanks for immediate reply, Can you please send a small application of it, it would really be very helpfull
Thanks
- Mark as New
- Bookmark
- Subscribe
- Mute
- Subscribe to RSS Feed
- Permalink
- Report Inappropriate Content
PFA the sample application.
Best,
S
- Mark as New
- Bookmark
- Subscribe
- Mute
- Subscribe to RSS Feed
- Permalink
- Report Inappropriate Content
But here how it is possible to find the value for Maximum of month
- Mark as New
- Bookmark
- Subscribe
- Mute
- Subscribe to RSS Feed
- Permalink
- Report Inappropriate Content
Oh you want to get the max value of the month. Let me fix my expression and get back to you.
Best,
S
- Mark as New
- Bookmark
- Subscribe
- Mute
- Subscribe to RSS Feed
- Permalink
- Report Inappropriate Content
Hi find attached app .
if(GetCurrentField(Group)='Year',sum({<Month={'dec'}>}Value),if(GetCurrentField(Group)='Quarter',sum({<Month={'mar','jun','sep','dec'}>}Value),Value))
- Mark as New
- Bookmark
- Subscribe
- Mute
- Subscribe to RSS Feed
- Permalink
- Report Inappropriate Content
Here User want the value of Last Month
- Mark as New
- Bookmark
- Subscribe
- Mute
- Subscribe to RSS Feed
- Permalink
- Report Inappropriate Content
Here you go. See if this is what you want.
Best,
S
- Mark as New
- Bookmark
- Subscribe
- Mute
- Subscribe to RSS Feed
- Permalink
- Report Inappropriate Content
Hey,
tried small example with year hardcoded 2014. In DImension i put Quarter , Month and in expression as:
Sum({<Year = {'2014'} , Month = {"=aggr(Max(Month), Quarter)"}>}Value)
It is giving em values for 1st month of Q1 and 1st month of Q2.
cAn anybody tell me why is it so when i have used Max(Month) ??
Thanks
- « Previous Replies
- Next Replies »