Unlock a world of possibilities! Login now and discover the exclusive benefits awaiting you.
- Qlik Community
- :
- All Forums
- :
- QlikView App Dev
- :
- Daily Data vs a Total Target
- Subscribe to RSS Feed
- Mark Topic as New
- Mark Topic as Read
- Float this Topic for Current User
- Bookmark
- Subscribe
- Mute
- Printer Friendly Page
- Mark as New
- Bookmark
- Subscribe
- Mute
- Subscribe to RSS Feed
- Permalink
- Report Inappropriate Content
Daily Data vs a Total Target
Hello,
I have daily figures for one set of data, with another set of data on a monthly basis (a target).
I can graph the daily sales which accumulate, however I want to track these against a target which I have at a monthly level.
i.e.
Is there an easy way to do this please?
Many Thanks
- Tags:
- new_to_qlikview
- Mark as New
- Bookmark
- Subscribe
- Mute
- Subscribe to RSS Feed
- Permalink
- Report Inappropriate Content
Not sure if I completely understand your question. Is your dimension month or day here?? Please provide a sample if you could.
Best,
Sunny
- Mark as New
- Bookmark
- Subscribe
- Mute
- Subscribe to RSS Feed
- Permalink
- Report Inappropriate Content
Ie. I have sales daily but a target at a monthly level:
DAY SALES
day1 10
day2 15
day3 20
day4 25
day5 30
day6 35
But with a target of the total month ie. 50
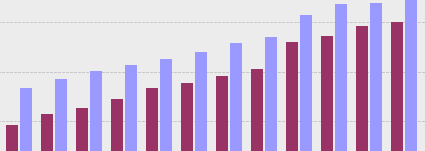
So when It is graphed it looks like this:
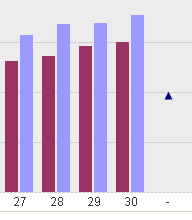
As the target is not split down to a daily level
- Mark as New
- Bookmark
- Subscribe
- Mute
- Subscribe to RSS Feed
- Permalink
- Report Inappropriate Content
So for each day you would show 50 as the target??? compared to cumulative sales
Is that what the goal is?
Best,
Sunny
- Mark as New
- Bookmark
- Subscribe
- Mute
- Subscribe to RSS Feed
- Permalink
- Report Inappropriate Content
No, I would want to calculate the target per day so 50/6 = 8.3
DAY SALES TARGET
day1 10 8.3
day2 15 8.3
day3 20 8.3
day4 25 8.3
day5 30 8.3
day6 35 8.3
On a graph this would then be able to be accumulated back up to 50
- Mark as New
- Bookmark
- Subscribe
- Mute
- Subscribe to RSS Feed
- Permalink
- Report Inappropriate Content
Have a look at the attached qvw file, is this close to what you are looking for? I didn't have the data structure with me so I used hardcoded 50 here, but have a look.
Best,
Sunny
- Mark as New
- Bookmark
- Subscribe
- Mute
- Subscribe to RSS Feed
- Permalink
- Report Inappropriate Content
I normally break down the monthly target into a daily target based on the numbers of days in a month
- Mark as New
- Bookmark
- Subscribe
- Mute
- Subscribe to RSS Feed
- Permalink
- Report Inappropriate Content
Yes I can do that, also but it does not have any relationship to the days?