Unlock a world of possibilities! Login now and discover the exclusive benefits awaiting you.
- Qlik Community
- :
- All Forums
- :
- QlikView App Dev
- :
- Data Relationships
- Subscribe to RSS Feed
- Mark Topic as New
- Mark Topic as Read
- Float this Topic for Current User
- Bookmark
- Subscribe
- Mute
- Printer Friendly Page
- Mark as New
- Bookmark
- Subscribe
- Mute
- Subscribe to RSS Feed
- Permalink
- Report Inappropriate Content
Data Relationships
I have a pivot table showing a list of customers. The expressions give me values for Sales - GP - GP%.
Currently I need to add another column which encorporates an exchange rate. My problem is that these rates are being sucked in from a spreadsheet. (There is a different exchange rate for each month.)
When i bring in the exchange rate it only appears for the total values and there is a 0 value for each customer.
Does anyone know what i can do to have each customer's exchange rate showing?
Thanks
- « Previous Replies
-
- 1
- 2
- Next Replies »
- Mark as New
- Bookmark
- Subscribe
- Mute
- Subscribe to RSS Feed
- Permalink
- Report Inappropriate Content
- Mark as New
- Bookmark
- Subscribe
- Mute
- Subscribe to RSS Feed
- Permalink
- Report Inappropriate Content
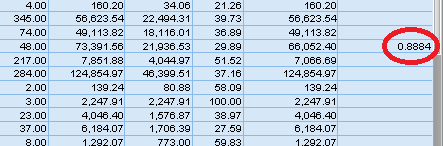
Apologies if my first post was confusing. Basically I want to have the exchange rate, as seen in the picture, be populated all the way down the column... I'll post a clearer picture here.
Thanks in advance to anyone who can shed any light on what my problem is...
Anyone know why is the exchange rate only being picked up by certain lines?
- Mark as New
- Bookmark
- Subscribe
- Mute
- Subscribe to RSS Feed
- Permalink
- Report Inappropriate Content
Post a picture of the table viewer b/c I'm not sure how it's associated if at all without seeing a picture.
- Mark as New
- Bookmark
- Subscribe
- Mute
- Subscribe to RSS Feed
- Permalink
- Report Inappropriate Content
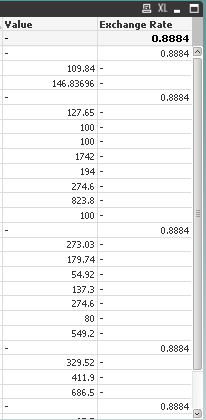
Thanks for the reply!
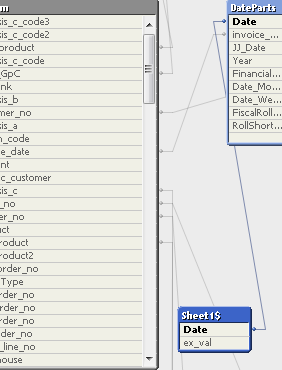
The ex_val is my exchange rate...
This is the result in my table....
- Mark as New
- Bookmark
- Subscribe
- Mute
- Subscribe to RSS Feed
- Permalink
- Report Inappropriate Content
I suggest you to load your exchange rate table not in a new table, but in the "DateParts" table using a
LEFT JOIN (DateParts)
LOAD DISTINCT Date, ex_val FROM your Excel file;
After that, you are sure to have 1 rate (maximum) for each date.
It's hard to understand what you are trying to do because every picture are cropped to hide your column headers...
Does anyone know what i can do to have each customer's exchange rate showing?
The part I don't understand is that an exchange rate is based on a date, but in your chart, you don't have a dimension "date".
You can display a customer exchange rate only if you have only 1 date linked to your customer !
- Mark as New
- Bookmark
- Subscribe
- Mute
- Subscribe to RSS Feed
- Permalink
- Report Inappropriate Content
Does the table with the exchange-rate have an entry for each date?
Otherwise you need to modify the date in the "DateParts"-table to be inline with the external table, check the MONTHSTART-function or the like and link the exchange-rates to this field then.
Otherwise please post an example of your application.
HTH
Peter
- Mark as New
- Bookmark
- Subscribe
- Mute
- Subscribe to RSS Feed
- Permalink
- Report Inappropriate Content
Apologies for the confusion, there is a dimension for date in my document, its basically a listbox displaying months. I also have a list box with the exchange rates.
In my spreadsheet where the values for the exchange rates are stored, there is a different exchange rate for each month. Thus, when I click on a month in my month listbox, the exchange rate is shown on the exchange rate listbox.
The exchange rates are NOT linked to customers, they're linked to months.
I hope this clears it up some of the confusion. Thanks
- Mark as New
- Bookmark
- Subscribe
- Mute
- Subscribe to RSS Feed
- Permalink
- Report Inappropriate Content
Brian,
Then create a Month link in the calendar.
Something like this:
| Calendar Table | Exchange Rate Table |
| Month(Date) As Month | |
| Month(Date) As LinkMonth | Month(Date) As LinkMonth |
| ExchangeRate |
If you have no calendar, then left join load the Exchange rate table into the fact table with LinkMonth as the common data element.
Regards,
Rich
- Mark as New
- Bookmark
- Subscribe
- Mute
- Subscribe to RSS Feed
- Permalink
- Report Inappropriate Content
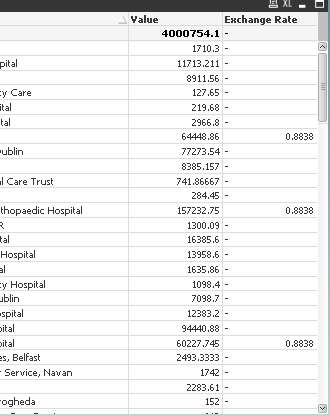
Thanks for the reply Richard. I already have the exchange rate linked to the appropriate month. My issue is that the exchange rate is not being applied to each customer in my pivot table. For example in the below picture, I have March 2011 highlighted on my listbox, the correct exchange rate is being shown, however it is only being applied to a certain amount of customers.
I want to be in a position where I can manipulate the Value with the exchange rate but currently im not in a position to do so. Words cannot express my frustration!
- « Previous Replies
-
- 1
- 2
- Next Replies »