Unlock a world of possibilities! Login now and discover the exclusive benefits awaiting you.
- Qlik Community
- :
- All Forums
- :
- QlikView App Dev
- :
- Dates, set analysis?
- Subscribe to RSS Feed
- Mark Topic as New
- Mark Topic as Read
- Float this Topic for Current User
- Bookmark
- Subscribe
- Mute
- Printer Friendly Page
- Mark as New
- Bookmark
- Subscribe
- Mute
- Subscribe to RSS Feed
- Permalink
- Report Inappropriate Content
Dates, set analysis?
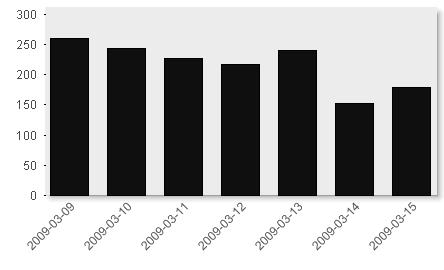
I would like to sum the amount of customers like on the picture added but for example if the date is 2009-03-09 the the customers that have been visiting between 2009-03-08 19:00 and 2009-03-09 19:00 are summarized. Can I achieve it with set-analysis?
//Liivi
- Mark as New
- Bookmark
- Subscribe
- Mute
- Subscribe to RSS Feed
- Permalink
- Report Inappropriate Content
As far as I know, you can't... If my understanding is correct, the Set Analysis expression is being evaluated "outside" of the context of the current cell in your chart, therefore we can't use the current dimension value (e.g. Date) in the set analysis expression.
I'd be very happy to see a solution to this problem, because problems of this kind have been bugging me for a while...
As far as I understand your problem, you can either use an IF statement (which is slow, if you have a lot of data), or solve this problem back in the script and associate the relevant timestamps with the desired Dates.
cheers,
- Mark as New
- Bookmark
- Subscribe
- Mute
- Subscribe to RSS Feed
- Permalink
- Report Inappropriate Content
I agree with Oleg that you would need to do it in the script. Come up with a routine that will group those time periods into the appropriate groupings/buckets. Probably can use intervalmatch.
Could you provide us with some sample data to test it out?
- Mark as New
- Bookmark
- Subscribe
- Mute
- Subscribe to RSS Feed
- Permalink
- Report Inappropriate Content
Here I made an qv-application. It looks a bit strange so I even add the excel sheet with information.
- Mark as New
- Bookmark
- Subscribe
- Mute
- Subscribe to RSS Feed
- Permalink
- Report Inappropriate Content
And excelsheet
- Mark as New
- Bookmark
- Subscribe
- Mute
- Subscribe to RSS Feed
- Permalink
- Report Inappropriate Content
Anyone?
- Mark as New
- Bookmark
- Subscribe
- Mute
- Subscribe to RSS Feed
- Permalink
- Report Inappropriate Content
Regarding Oleg post, I agree, but i thought that Version 9 of qlikview was allowing set analysis outside of the context ?
So maybe (maybe !) you should have a look at set analysis in ver 9. but i didn't see it yet.
Regards,
Sébastien