Unlock a world of possibilities! Login now and discover the exclusive benefits awaiting you.
- Qlik Community
- :
- All Forums
- :
- QlikView App Dev
- :
- Decile Chart
Options
- Subscribe to RSS Feed
- Mark Topic as New
- Mark Topic as Read
- Float this Topic for Current User
- Bookmark
- Subscribe
- Mute
- Printer Friendly Page
Turn on suggestions
Auto-suggest helps you quickly narrow down your search results by suggesting possible matches as you type.
Showing results for
Contributor
2013-03-19
01:25 PM
- Mark as New
- Bookmark
- Subscribe
- Mute
- Subscribe to RSS Feed
- Permalink
- Report Inappropriate Content
Decile Chart
Hello,
I want to create a chart that shows the distribution of % of sales against % of items.
For example..
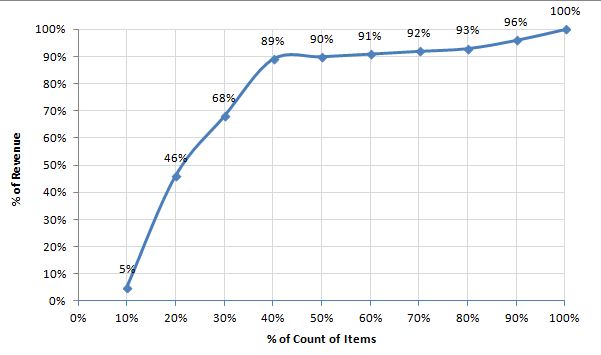
This example shows that we made 89% of our revenue from 40% of our products.
Assuming the data model is just...
Item Revenue
A 100
B 200
C 300
D 400
And I'd like it in 10% blocks as in the chart above.
Can anyone give me advice on how to build the dimensions for this chart...?
Many thanks in advance!
Darren
707 Views
0 Replies