Unlock a world of possibilities! Login now and discover the exclusive benefits awaiting you.
- Qlik Community
- :
- All Forums
- :
- QlikView App Dev
- :
- Decisiontree visualisation with scatter plot
- Subscribe to RSS Feed
- Mark Topic as New
- Mark Topic as Read
- Float this Topic for Current User
- Bookmark
- Subscribe
- Mute
- Printer Friendly Page
- Mark as New
- Bookmark
- Subscribe
- Mute
- Subscribe to RSS Feed
- Permalink
- Report Inappropriate Content
Decisiontree visualisation with scatter plot
Hello everyone,
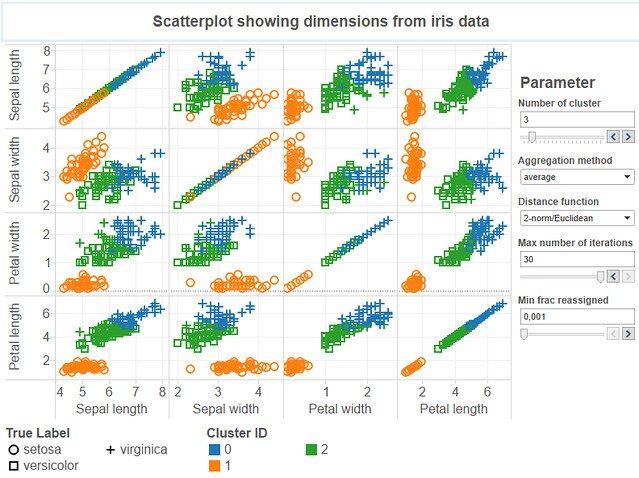
I'm trying to visulize my Decision Tree. I would prefer something like this: https://farm3.staticflickr.com/2942/15194160150_c4e1d356bd_z.jpg
I have many, many fields like this %StationYearKey;station_longitude_deg;station_latitude_deg;station_altitude;Pop_Dichte;Yield (100 kg/ha);Harvested production (1000 t);Area (cultivation/harvested/production) (1000 ha);Main area (1000 ha);milk;goats;sheeps;pigs;buffaloes;cows and bovine;Wetland;Water;Bare land;Grassland;Shrubland;Woodland;Cropland;Artificial land;O3_class
but perhaps my final decision tree uses only 10 attributes.
I search for a easy way to get from my model with looks like this:
Learned classification tree model:
DecisionTreeModel classifier of depth 6 with 103 nodes
If (feature 0 <= 0.072434549052584)
If (feature 7 <= 32.81)
If (feature 4 <= 448.24)
If (feature 6 <= 18.19)
If (feature 6 <= 0.0)
If (feature 5 <= 1364.1)
Predict: 1.0
Else (feature 5 > 1364.1)
Predict: 0.0
Else (feature 6 > 0.0)
Predict: 2.0
Else (feature 6 > 18.19)
Predict: 0.0
Else (feature 4 > 448.24)
If (feature 7 <= 15.66)
Predict: 2.0
Else (feature 7 > 15.66)
If (feature 4 <= 1729.98)
Predict: 1.0
Else (feature 4 > 1729.98)
If (feature 3 <= 842.7)
Predict: 1.0
Else (feature 3 > 842.7)
Predict: 2.0
....
to a nice and easy visualisation, because I have to do it at least 5 times.
Hoping for inspiration for data modelling and visualisation tips:)
Accepted Solutions
- Mark as New
- Bookmark
- Subscribe
- Mute
- Subscribe to RSS Feed
- Permalink
- Report Inappropriate Content
Hi,
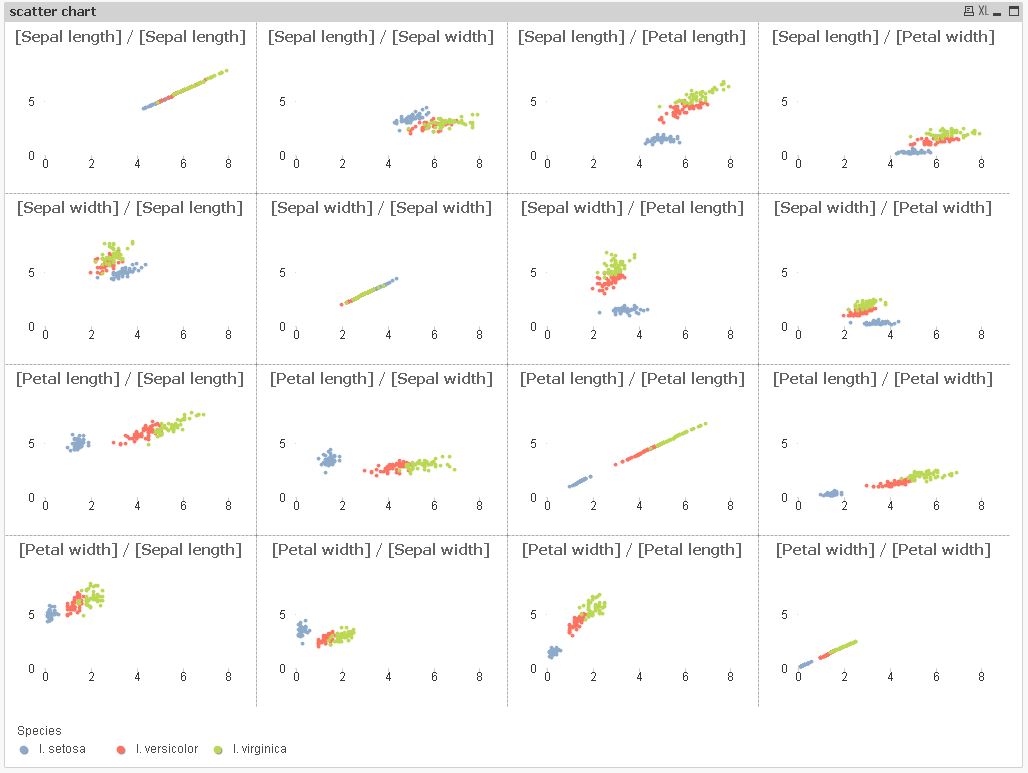
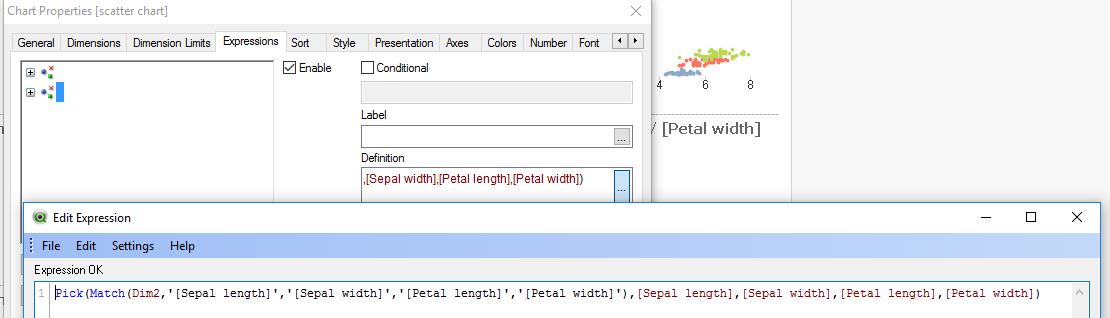
one implementation of the multivariate trellis scatter chart could be:

tabIrisData:
LOAD RecNo() as SampleID,
*
FROM [https://en.wikipedia.org/wiki/Iris_flower_data_set] (html, codepage is 1252, embedded labels, table is [Fisher's Iris Data]);
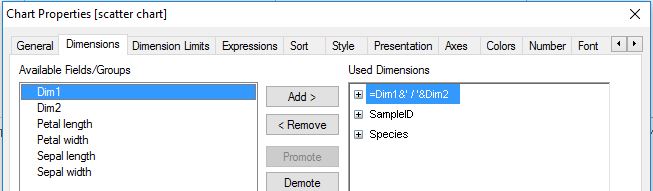
tabDim1:
LOAD * INLINE "
Dim1
[Sepal length]
[Sepal width]
[Petal length]
[Petal width]
";
tabDim2:
LOAD Dim1 as Dim2 Resident tabDim1;
hope this helps
regards
Marco
- Mark as New
- Bookmark
- Subscribe
- Mute
- Subscribe to RSS Feed
- Permalink
- Report Inappropriate Content
Hi,
one implementation of the multivariate trellis scatter chart could be:
tabIrisData:
LOAD RecNo() as SampleID,
    *
FROM [https://en.wikipedia.org/wiki/Iris_flower_data_set] (html, codepage is 1252, embedded labels, table is [Fisher's Iris Data]);

tabDim1:
LOAD * INLINE "
    Dim1
    [Sepal length]
    [Sepal width]
    [Petal length]
    [Petal width]
";

tabDim2:
LOAD Dim1 as Dim2 Resident tabDim1;
hope this helps
regards
Marco
- Mark as New
- Bookmark
- Subscribe
- Mute
- Subscribe to RSS Feed
- Permalink
- Report Inappropriate Content
Thanks a lot:)
- Mark as New
- Bookmark
- Subscribe
- Mute
- Subscribe to RSS Feed
- Permalink
- Report Inappropriate Content
You're welcome.
Regards
Marco