Unlock a world of possibilities! Login now and discover the exclusive benefits awaiting you.
- Qlik Community
- :
- All Forums
- :
- QlikView App Dev
- :
- Designing Pie Chart?
- Subscribe to RSS Feed
- Mark Topic as New
- Mark Topic as Read
- Float this Topic for Current User
- Bookmark
- Subscribe
- Mute
- Printer Friendly Page
- Mark as New
- Bookmark
- Subscribe
- Mute
- Subscribe to RSS Feed
- Permalink
- Report Inappropriate Content
Designing Pie Chart?
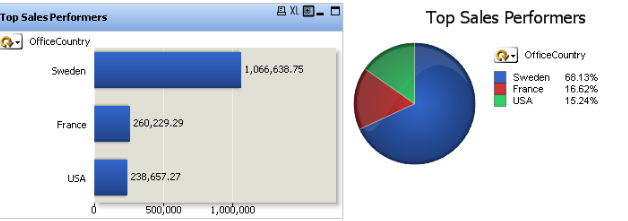
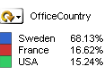
This is the reference chart.
I unable produce below part in the pie chart design how can i achieve this?
Any insights would be helpful?
- Mark as New
- Bookmark
- Subscribe
- Mute
- Subscribe to RSS Feed
- Permalink
- Report Inappropriate Content
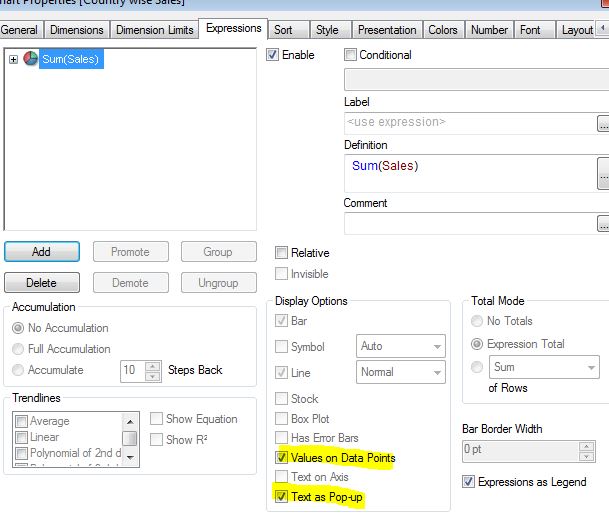
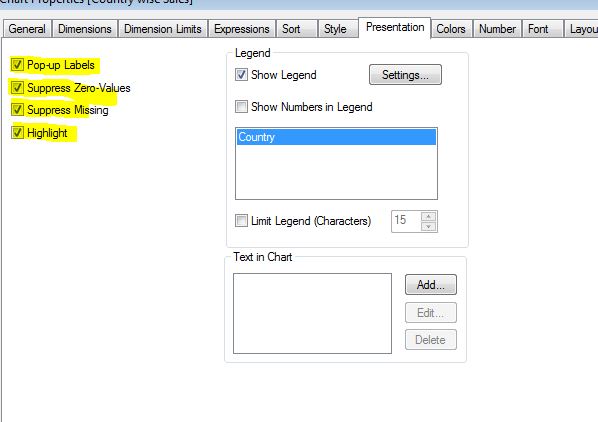
1) Check Show Legent at Presentation Tab
2) Mark your expression as "Relative"
- Mark as New
- Bookmark
- Subscribe
- Mute
- Subscribe to RSS Feed
- Permalink
- Report Inappropriate Content
please post a sample qvw to demonstrate with.
thanks
regards
Marco
- Mark as New
- Bookmark
- Subscribe
- Mute
- Subscribe to RSS Feed
- Permalink
- Report Inappropriate Content
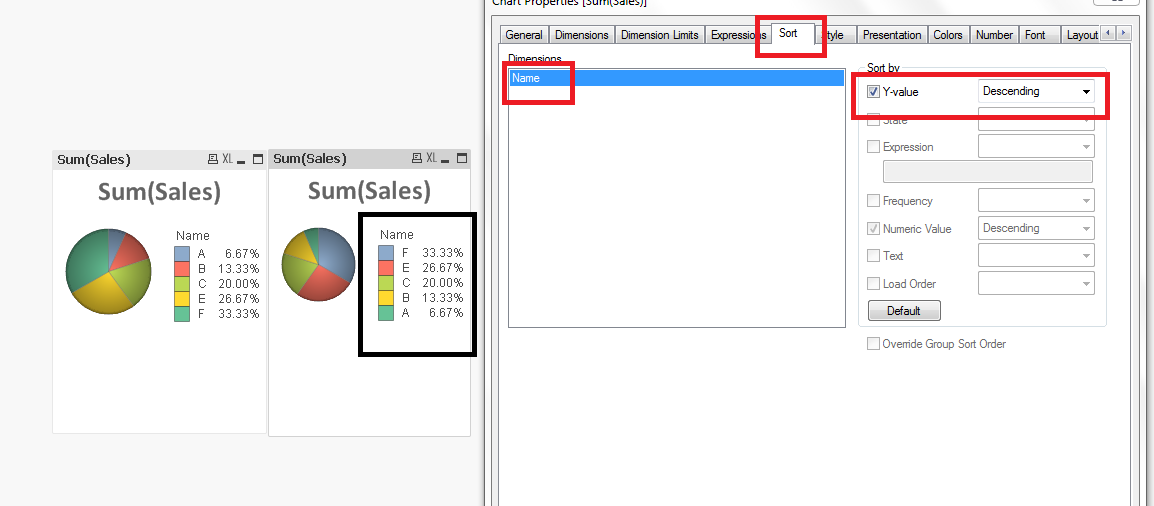
Using Show values in legend worked out for me.
How can i sort the values ? Highest values should be on top
Sweden 10%
Usa 60%
India 30%
I want it to display as
Usa 60%
India 30%
Sweden 10%
- Mark as New
- Bookmark
- Subscribe
- Mute
- Subscribe to RSS Feed
- Permalink
- Report Inappropriate Content
Do you mean this
- Mark as New
- Bookmark
- Subscribe
- Mute
- Subscribe to RSS Feed
- Permalink
- Report Inappropriate Content
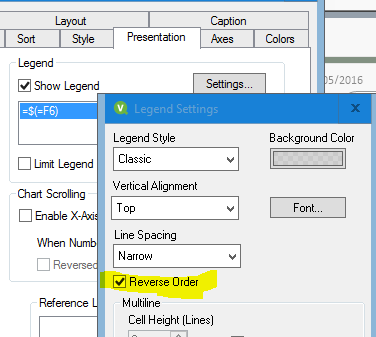
At Presentation tab, check "Reverse Order"
- Mark as New
- Bookmark
- Subscribe
- Mute
- Subscribe to RSS Feed
- Permalink
- Report Inappropriate Content
Hi Srikanth,
I have tried the aimple example containing the country and sales.
Dimension: Country
Expression:Sum(Sales)
Bar:
LOAD * INLINE [
Country, Sales
IND, 100
USA, 200
JAP, 222
CHI, 111
AUS, 121
UK, 156
RUS, 178
];
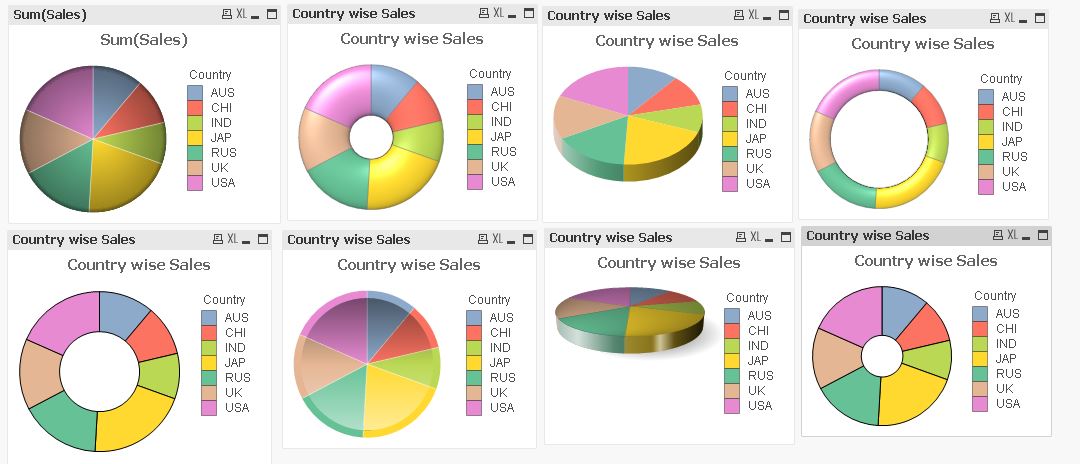
Please give some idea about your exact requirement that what you want to do in pie chart.
I have almost covers all the scenario.
Regards,
Yogesh J