Unlock a world of possibilities! Login now and discover the exclusive benefits awaiting you.
Announcements
Save $650 on Qlik Connect, Dec 1 - 7, our lowest price of the year. Register with code CYBERWEEK: Register
- Qlik Community
- :
- All Forums
- :
- QlikView App Dev
- :
- Different axes in boxplot diagram
Options
- Subscribe to RSS Feed
- Mark Topic as New
- Mark Topic as Read
- Float this Topic for Current User
- Bookmark
- Subscribe
- Mute
- Printer Friendly Page
Turn on suggestions
Auto-suggest helps you quickly narrow down your search results by suggesting possible matches as you type.
Showing results for
Anonymous
Not applicable
2018-03-14
10:28 AM
- Mark as New
- Bookmark
- Subscribe
- Mute
- Subscribe to RSS Feed
- Permalink
- Report Inappropriate Content
Different axes in boxplot diagram
Hey,
maybe someone can help me with this issue.
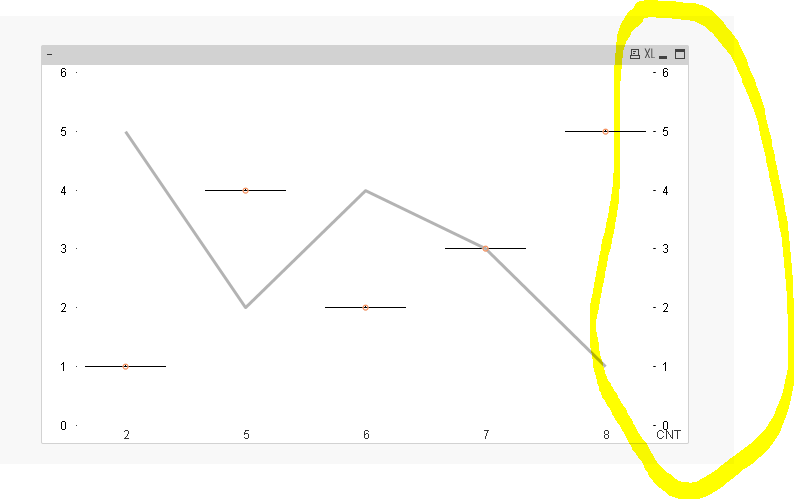
I want to display a boxplot diagram and additionnally the average of a value x.
Then I want to use the left axis for the boxplots and the right axis for value x.
Unfortunately the right axis is always the same as the left one no matter what definement I choose.
I use version 12.20.20200.0
369 Views
0 Replies