Unlock a world of possibilities! Login now and discover the exclusive benefits awaiting you.
Announcements
Qlik Open Lakehouse is Now Generally Available! Discover the key highlights and partner resources here.
- Qlik Community
- :
- All Forums
- :
- QlikView App Dev
- :
- Different colours of a line depending on its value
Options
- Subscribe to RSS Feed
- Mark Topic as New
- Mark Topic as Read
- Float this Topic for Current User
- Bookmark
- Subscribe
- Mute
- Printer Friendly Page
Turn on suggestions
Auto-suggest helps you quickly narrow down your search results by suggesting possible matches as you type.
Showing results for
Not applicable
2011-05-25
09:24 AM
- Mark as New
- Bookmark
- Subscribe
- Mute
- Subscribe to RSS Feed
- Permalink
- Report Inappropriate Content
Different colours of a line depending on its value
Hi, I don`y konw if this can be done in QV so i ask you everybody:
I have a Graphic lines with shows the Incomes Amount as a line graph. The months are on the X-axis, the Amount Value in the Y-axis, and the Field Year is the series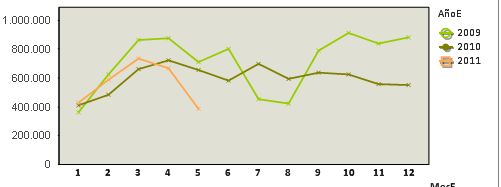
What I'm trying to do is that the line of the 2011 year has a green colour when Its above the 2010. (In general the current year regarding the last year) and a red colour when It's belove. I mean, a line with two colours depending on its value.
Thanks a lot for your replys.
2,642 Views
0 Replies