Unlock a world of possibilities! Login now and discover the exclusive benefits awaiting you.
- Qlik Community
- :
- All Forums
- :
- QlikView
- :
- Different results for same expression
- Subscribe to RSS Feed
- Mark Topic as New
- Mark Topic as Read
- Float this Topic for Current User
- Bookmark
- Subscribe
- Mute
- Printer Friendly Page
- Mark as New
- Bookmark
- Subscribe
- Mute
- Subscribe to RSS Feed
- Permalink
- Report Inappropriate Content
Different results for same expression
Hi all.
I'm facing the following situation, and I hope someone could help me.
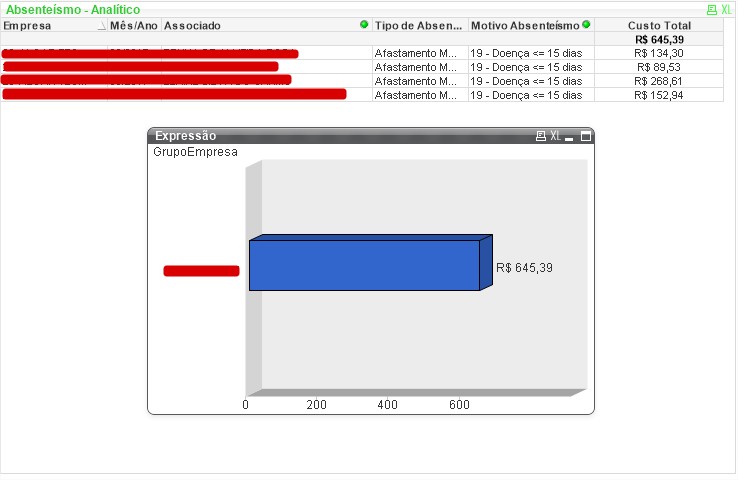
I've got two charts with the same expression. A simple table and a bar chart.
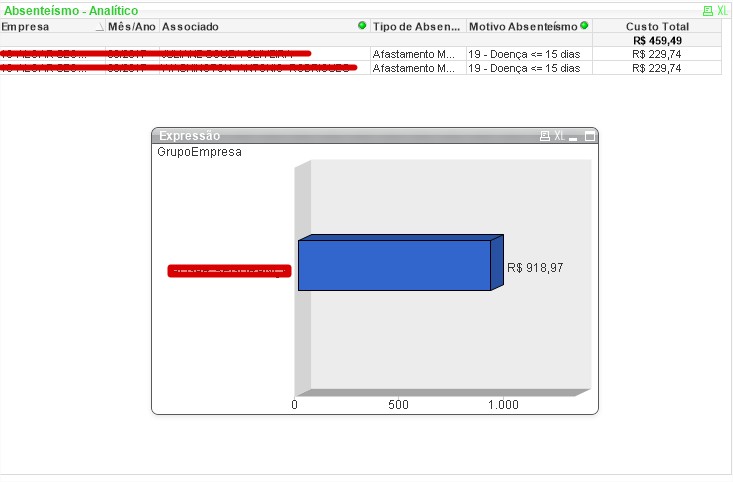
The logic that I see on the data presentation is...
On the table:
1 employee selected = R$ 229,74
2 employees selected = 229,74 + 229,74= R$ 459,49
On the bar chart:
1 employee selected = (229,74) * 1 = R$ 229,74
2 employees selected = (229,74 + 229,74) * 2 = 918,97
If I select more employees, the total cost (Custo total) on bar chart will grow exponentially, but the total cost on the table(last column) grows correctly.
The expression I'm using is:
=((Sum ({$<[Tipo de Absenteísmo]-={'Licença*'}>}SalarioContratual_Valor)*2.15)/30)*Sum (Absent_DiasMes)
Also, if I choose the dimension Employee (Associado) on the bar chart, it returns the correct value.
Hope someone help.
Regards,
Joffre Mota
Accepted Solutions
- Mark as New
- Bookmark
- Subscribe
- Mute
- Subscribe to RSS Feed
- Permalink
- Report Inappropriate Content
May be try this expression for your chart
Sum(Aggr(((Sum ({$<[Tipo de Absenteísmo]-={'Licença*'}>}SalarioContratual_Valor)*2.15)/30)*Sum (Absent_DiasMes),
Your straight table's dimension)
- Mark as New
- Bookmark
- Subscribe
- Mute
- Subscribe to RSS Feed
- Permalink
- Report Inappropriate Content
May be try this expression for your chart
Sum(Aggr(((Sum ({$<[Tipo de Absenteísmo]-={'Licença*'}>}SalarioContratual_Valor)*2.15)/30)*Sum (Absent_DiasMes),
Your straight table's dimension)
- Mark as New
- Bookmark
- Subscribe
- Mute
- Subscribe to RSS Feed
- Permalink
- Report Inappropriate Content