Unlock a world of possibilities! Login now and discover the exclusive benefits awaiting you.
- Qlik Community
- :
- All Forums
- :
- QlikView App Dev
- :
- Difficulty with aggr(count(distinct ... stuck, but...
- Subscribe to RSS Feed
- Mark Topic as New
- Mark Topic as Read
- Float this Topic for Current User
- Bookmark
- Subscribe
- Mute
- Printer Friendly Page
- Mark as New
- Bookmark
- Subscribe
- Mute
- Subscribe to RSS Feed
- Permalink
- Report Inappropriate Content
Difficulty with aggr(count(distinct ... stuck, but feel it should be easy!
Hi,
I feel pretty silly to be stuck on this so hopefully someone will have an easy solution...
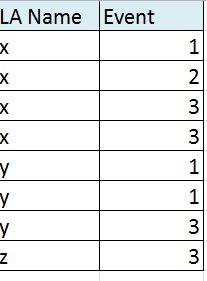
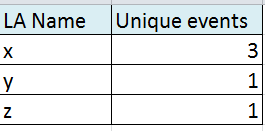
This is a mock-up of my data. I want to calculate how many different events LA Name X,y,z ... went to (see seccond immage).
I want it to create a tabe like this:
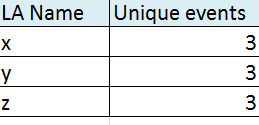
I have tried variatoins of this aggr(count(distinct [Event]),[LA Name]) but this produces this instead.
Any ideas?
Thanks,
Isabel
Accepted Solutions
- Mark as New
- Bookmark
- Subscribe
- Mute
- Subscribe to RSS Feed
- Permalink
- Report Inappropriate Content
The
[LA Name] - Count(distinct Event)
should be correct.
Could you upload some test data(where it does not work), so we can see whats wrong?
- Mark as New
- Bookmark
- Subscribe
- Mute
- Subscribe to RSS Feed
- Permalink
- Report Inappropriate Content
Use LA Name as dimension and count(distinct Event) as expression. But using your sample data that won't give you the result table you're looking for because there are two distinct Event values for Y: 1 and 3.
See attached example.
talk is cheap, supply exceeds demand
- Mark as New
- Bookmark
- Subscribe
- Mute
- Subscribe to RSS Feed
- Permalink
- Report Inappropriate Content
Hi,
Yes, I have LA name as the dimension, and I have tried count(distinct Event), however it still seems to count the total number of distinct events, i.e. 3 everywhere, and I am certain that this is not what the underlying data says!
- Mark as New
- Bookmark
- Subscribe
- Mute
- Subscribe to RSS Feed
- Permalink
- Report Inappropriate Content
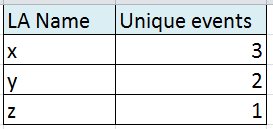
And you are right, that was a typo. For clarity, the result I want is:
- Mark as New
- Bookmark
- Subscribe
- Mute
- Subscribe to RSS Feed
- Permalink
- Report Inappropriate Content
The
[LA Name] - Count(distinct Event)
should be correct.
Could you upload some test data(where it does not work), so we can see whats wrong?
- Mark as New
- Bookmark
- Subscribe
- Mute
- Subscribe to RSS Feed
- Permalink
- Report Inappropriate Content
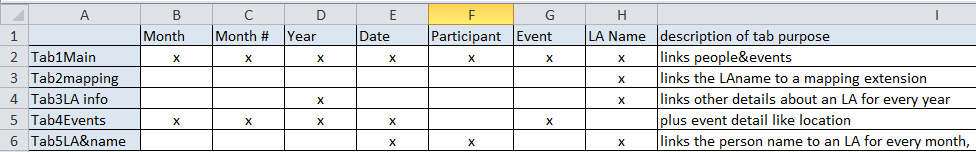
Ok, so it must be with the way I have linked all my tables... Looking at all the common fields across my data, I have sketched up the structure showing the different tables/tabs I have brought in. Can you see why I am getting the unexpected result? I am really puzzled, but I think it may be an issue with the "Date" field in common.
As background: Every Participant belongs to an LA Name all the time. Participants then attend Events and I have other details about the Event and the LA Name. All this information then gets mapped onto a map of the UK.
- Mark as New
- Bookmark
- Subscribe
- Mute
- Subscribe to RSS Feed
- Permalink
- Report Inappropriate Content
I think this is now to do with loosely coupled tables and so I will open up a new discussion point with a more appropriate title. Thanks for your responses