Unlock a world of possibilities! Login now and discover the exclusive benefits awaiting you.
- Qlik Community
- :
- All Forums
- :
- QlikView App Dev
- :
- Dimension + calculated value
- Subscribe to RSS Feed
- Mark Topic as New
- Mark Topic as Read
- Float this Topic for Current User
- Bookmark
- Subscribe
- Mute
- Printer Friendly Page
- Mark as New
- Bookmark
- Subscribe
- Mute
- Subscribe to RSS Feed
- Permalink
- Report Inappropriate Content
Dimension + calculated value
Hello all,
I have two date fields. One is registration year and second is bill year. I also counted unique serialno under each year as you see in
the picture bellow.
Then I created pivot table which contains bouth data fields and one expression where I count how many workorder I have under each year.
My quastion is: Is it possible to somehow show YearFREGD and YearBILLD together with figures from previous expressions?
For example: YearFREGD => 2007(707), YearBILLD => 2006(28), 2007(610), 2008(577), 2009(476), 2010(428), 2011(394), 2012(369)
and 2013(301)
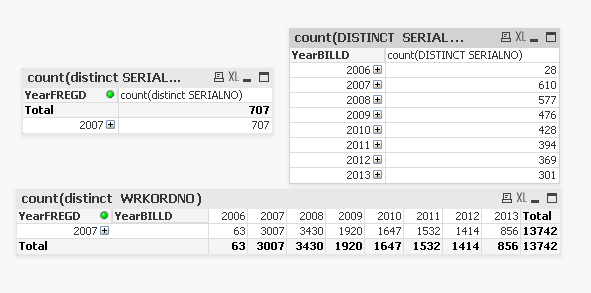
The new table should look like this:
2006(28) 2007(610) 2008(577) 2009(476) 2010(428) 2011(394) 2012(369) 2013(301)
2007(707) 63 3007 3430 1920 1647 1532 1414 856
Thanks