Unlock a world of possibilities! Login now and discover the exclusive benefits awaiting you.
- Qlik Community
- :
- All Forums
- :
- QlikView App Dev
- :
- Dimension
- Subscribe to RSS Feed
- Mark Topic as New
- Mark Topic as Read
- Float this Topic for Current User
- Bookmark
- Subscribe
- Mute
- Printer Friendly Page
- Mark as New
- Bookmark
- Subscribe
- Mute
- Subscribe to RSS Feed
- Permalink
- Report Inappropriate Content
Dimension
Bonjour à tous.
Voilà mon problème. J'essaye de construire un graphique courbe à partir d'un Excel où j'ai 2 colonnes (valeur et date).
J'ai une valeur par semaine (associée au lundi) donc au total 52 valeurs.
Ce que j'aimerai c'est affiché mes 52 valeurs (ce que j'arrive à faire) avec en ordonnée non pas la date où le numéro de semaine mais le mois correspondant. Pour les 4 premières avoir Janvier, les 4 suivantes Février etc...
J'ai essayé plusieurs solutions avec plus ou moins de réussite. Notamment j'ai ajouté une expression qui me donne le mois correspondant à mon champ date que j'affiche avec l'option "Texte sur l'axe". En utilisant la fonction Above je n'affiche qu'une fois chaque mois.
Y aurait-il une autre solution?
Merci d'avance pour votre aide.
Cordialement,
- Tags:
- new_to_qlikview
- Mark as New
- Bookmark
- Subscribe
- Mute
- Subscribe to RSS Feed
- Permalink
- Report Inappropriate Content
Sorry I don´t speak french, but do you have a date value?
You can add a calculated dimension
month(mydate)
- Mark as New
- Bookmark
- Subscribe
- Mute
- Subscribe to RSS Feed
- Permalink
- Report Inappropriate Content
Hi, could you translate?
thank you
Fernando
- Mark as New
- Bookmark
- Subscribe
- Mute
- Subscribe to RSS Feed
- Permalink
- Report Inappropriate Content
use a calculated dimension with dual
=dual(month(d),d) // d is date
and in number tab use expression default
- Mark as New
- Bookmark
- Subscribe
- Mute
- Subscribe to RSS Feed
- Permalink
- Report Inappropriate Content
Hi all,
Sorry for the french language.
I try to create a line chart from an Excel where I have two columns : Date and Value.
I have one value by week so 52 by year.
On the X axis, i don't want to see the date or the week number but for the fourth first value Jan, fourth others Feb etc...
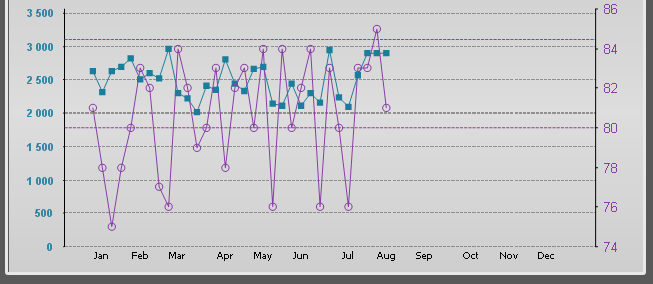
The dual function is helpful :
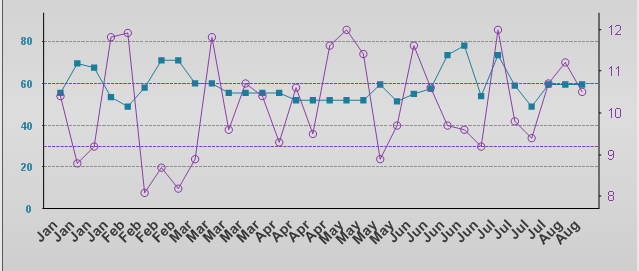
I tried to display only once time the label on the X axis :
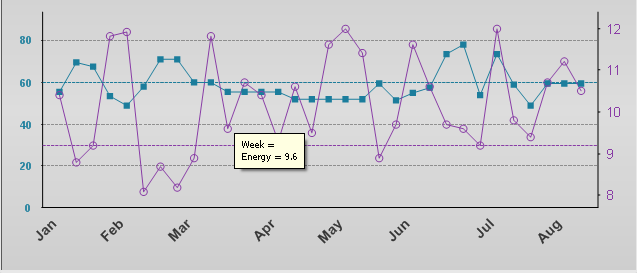
But as you can see, the label is not correct.
Thanks for help if you have other solutions.