Unlock a world of possibilities! Login now and discover the exclusive benefits awaiting you.
- Qlik Community
- :
- All Forums
- :
- QlikView App Dev
- :
- Display Expression value in label
- Subscribe to RSS Feed
- Mark Topic as New
- Mark Topic as Read
- Float this Topic for Current User
- Bookmark
- Subscribe
- Mute
- Printer Friendly Page
- Mark as New
- Bookmark
- Subscribe
- Mute
- Subscribe to RSS Feed
- Permalink
- Report Inappropriate Content
Display Expression value in label
Hi ,
I have a grid chart with bubble display, showing country ,risk category as dimension and count(risk) as expression.
I want to show the expression value as label.
If i make expression label=count(risk) its giving me total value instead of giving specific value to risk category.
Kindly suggest
Thanks,
Prajna
- Mark as New
- Bookmark
- Subscribe
- Mute
- Subscribe to RSS Feed
- Permalink
- Report Inappropriate Content
Use two expressions
1) COUNT(risk)
2) Dual('Country : '&Country&CHR(10) & 'Category : ' &Category & CHR(10) & 'Risk : ' & Count(Risk), Count(Risk))
Change Field names according to your application.
Go to presentation tab and untick PopUp Labels
- Mark as New
- Bookmark
- Subscribe
- Mute
- Subscribe to RSS Feed
- Permalink
- Report Inappropriate Content
Hi Manish,
It not working 
Regards,
Prajna
- Mark as New
- Bookmark
- Subscribe
- Mute
- Subscribe to RSS Feed
- Permalink
- Report Inappropriate Content
Provide your sample app here.
- Mark as New
- Bookmark
- Subscribe
- Mute
- Subscribe to RSS Feed
- Permalink
- Report Inappropriate Content
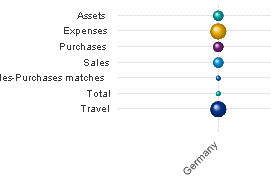
Basically i want the count inside the bubble. ex: sales 3 so on
- Mark as New
- Bookmark
- Subscribe
- Mute
- Subscribe to RSS Feed
- Permalink
- Report Inappropriate Content
It worked i added a dimension
=dual(aggr(count([Risk Factor Category]),[Target Tax Jurisdiction], [Risk Factor Category]),[Risk Factor Category])
Thanks for the reply
Regards,
Prajna